 |
|
By the Numbers: 2012 Violent Crime Totals Compared by Council Districts Mapping and Analysis by Jennifer Gomez
|

 |
|
|
By the Numbers: 2012 Violent Crime Totals Compared by Council Districts Mapping and Analysis by Jennifer Gomez
|
|
| (Feb. 14, 2013) -- LBREPORT.com reports below Long Beach City Council districts ranked by their Part 1 violent crimes against persons (murder + manslaughter + aggravated assault + rape + robbery) in 2012.
The data show:
These data were tabulated using LBPD's officially reported crime data but the tables below were not produced by the City of Long Beach or by LBPD. The crime totals were aggregated from LBPD Reporting Districts to represent Council District boundaries as closely as possible. Council boundaries and LBPD reporting districts aren't perfectly congruent but for statistical purposes, they are very close. Murder, Manslaughter, Aggravated Assault, Rape, Robbery
The 5th district's violent crime total is 12% of that in the 1st district. Put another way, the 1st district's violent crime total is over eight times that of the 5th Council district. These data are displayed on the graph below. 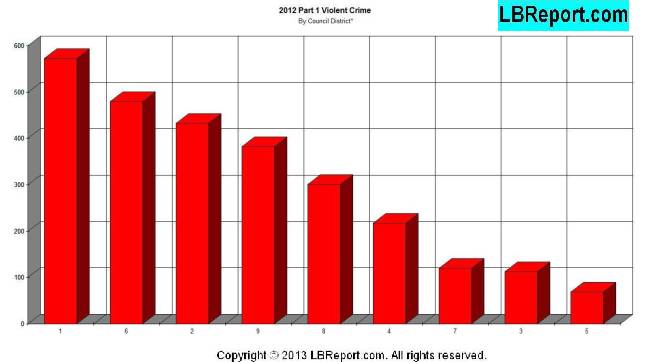 We accompany these data with context and caveats. Some official statistical categories combine more than one type of crime. An "Aggravated Assault" may be a shooting, or an assault with a knife, or a person hitting their spouse. LBREPORT.com will provide greater detail on these distinctions as we get them. LBPD assigns a number of rapes to reporting districts without geographic locations and accordingly they aren't included in these totals. Council district lines are political and thus to some extent inherently arbitrary, but since elected officials routinely seek credit for what takes place in their districts, we think it's appropriate to report crime by the Council districts that Councilmembers were elected to represent. Not all areas within a Council district experience the average rate. For example, the western portion of the 4th Council district (near Cherry Ave.) had significantly more violent crimes than the eastern end (Los Altos). Every statistic represents a person who became a crime victim in the City of Long Beach. They are not just numbers. They are people. Beyond those directly victimized, others living and working in crime-impacted areas have likely experienced streets blocked off by police vehicles, helicopters whirring overhead or may have been prevented from entering or leaving their neighborhoods by crime scene tape. Neighbors who've seen neighbors victimized may now take steps, some costly, others burdensome, to avoid becoming a victim as well. Their quality of life is impacted by what takes place around them even though they're not counted in the statistics below. LBREPORT.com welcomes your response to this data. Let us know in what part of town you are (major cross-streets are fine), who your Councilmember is and what voted actions you want him or her to take in response to this data. Use our Facebook and Disqus comment systems below to share your views...and feel free to let your friends and neighbors know about this page (via Facebook, Twitter or email). And watch for additional crime data coming...on LBREPORT.com. Due to an editing error, an early version of this text indicated the 5th dist. had a violent crime approx. every ten days; within a few hours we updated the text to indicate it is roughly every five days.
Contact us: mail@LBReport.com |
          Hardwood Floor Specialists Call (562) 422-2800 or (714) 836-7050  |
Contact us: mail@LBReport.com