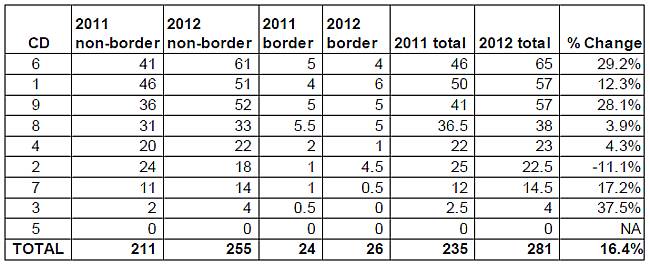
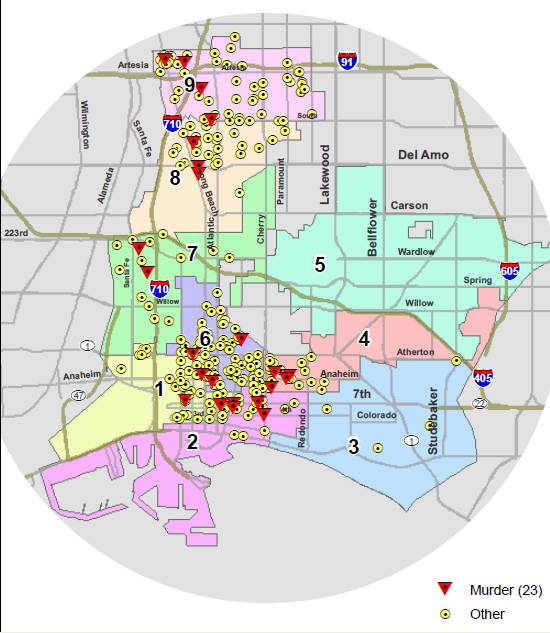
| (Feb. 25, 2013) -- A GIS mapping analysis of shooting locations in Long Beach in 2012 indicates that three Long Beach Council districts -- the 6th (Dee Andrews), the 1st (Robert Garcia) and the 9th (Steve Neal) -- accounted for over roughly 60% of Long Beach's shootings in 2012.
Long Beach had 281 shootings in 2012, a figure that includes "hit" shootings (person hit), "no hit" shootings and "246" shootings (refers to CA Penal Code section regarding shootings at an inhabited house, occupied building or occupied vehicle).
The 6th district had the largest number of shootings, followed by the 1st and the 9th districts with roughly the same amount. On average, there was over one shooting every week in the 6th, 1st and 9th Council district, something not seen in any other LB Council districts.
LBREPORT.com used LBPD shooting data which were independently mapped for LBREPORT.com by GIS mapping expert Jennifer Gomez. A small number of shootings in the three districts are along their borders with other Council districts (shown on the maps and listed in our computations). Even if every border shooting were removed from the three districts' totals, the total shootings for the 6th, 1st and 9th districts would still account for roughly 58% of the City's total.
Copyright 2013 LBREPORT.com. All rights reserved.
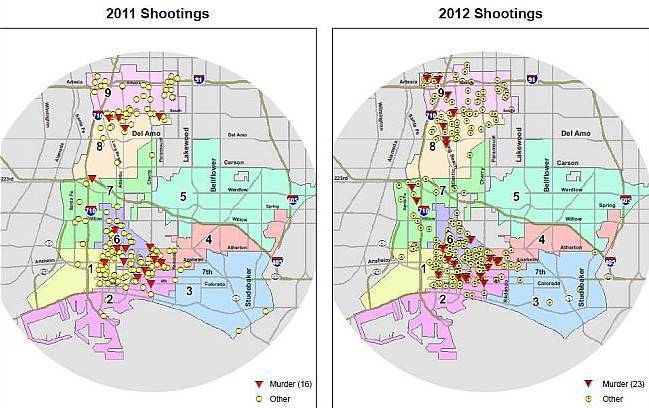
The 8th Council district shooting total (almost all north of Del Amo Blvd.) is roughly a third lower than the 1st and 9th districts; the 4th district (mainly concentrated in its western area) and 2nd district had even fewer (the 2nd dist. recorded a double-digit percentage drop in shootings from 2011). The 7th Council district had a little over a dozen shootings for the year.
The 3rd Council dist. had four shootings for the year. The 5th Council district had none.
LBPD provided shooting data indicated by the "100 block" of various streets (seen on our map, below). In terms of ranking districts, for shootings on a street that borders two Council districts as half for one district, half for the other (hence some "half" shootings when totaled). Shootings affect neighborhoods, not just a specific address...and associated police activity affects residents of both districts.
Copyright 2013 LBREPORT.com. All rights reserved.
Copyright 2013 LBREPORT.com. All rights reserved.
We add these caveats. LB Council district lines are political and thus to some extent inherently arbitrary, but since elected officials routinely seek credit for what takes place in their districts, we think it's appropriate to report crime by the Council districts that Councilmembers were elected to represent.
LBPD data listed two shootings as "shooting - homicide" rather than "shooting - murder." (There can be a distinction: every murder is a homicide but not necessarily vice versa). We've asked LBPD to help clarify the terminology as applied to the shooting data; a response is pending; we've shown them with red triangles as murders subject to revision if we hear differently. LBPD reported 30 murders in Long Beach in 2012 and the shooting data indicates at least 23 shootings were fatal (some murders were by means other than shootings).
Like an ultrasound or an x-ray, the images above are less than precise...but they are useful for analysis and interpretation. We invite our readers' interpretation and analysis...and we will continue to refine and update data as we receive it.
Finally, and very important: crime statistics reflect real people and neighborhoods victimized by crime in the City of Long Beach. They are not just numbers. They are people.
Beyond those directly victimized, residents and businesses in crime-impacted areas have likely experienced streets blocked off by police vehicles, helicopters whirring overhead or may have been prevented from entering or leaving their neighborhoods by crime scene tape. Neighbors who've seen neighbors victimized may now take steps, some costly, others burdensome, to avoid becoming a victim as well. Their quality of life is impacted by what takes place around them even though they're not counted in the statistics below.
LBREPORT.com welcomes your response to this data. Let us know in what part of town you are (major cross-streets are fine), who your Councilmember is and what voted actions you want him or her to take in response to this data.
Use our Facebook and Disqus comment systems below to share your views...and feel free to let your friends and neighbors know about this page (via Facebook, Twitter or email).
And watch for additional crime data coming...on LBREPORT.com.
Return To Front Page
Contact us: mail@LBReport.com
|