Yesterday (April 5), Councilman Austin sent us an email that he titled "8th district facts," which attached the photo from his Facebook message and stated: "How about reporting the truth?"
[Scroll down for further below.]
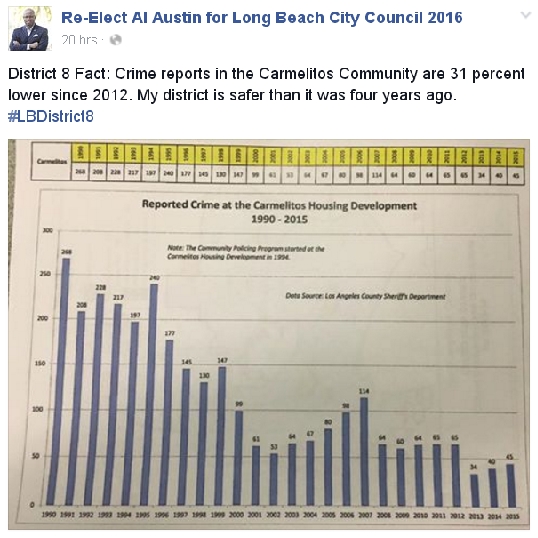
| (April 6, 2016, 4:10 p.m.) -- On April 5, eighth district City Council incumbent Al Austin, seeking re-election to a second four year term against challengers Laurie Angel and Wesley Turnbow, transmitted the Facebook message below, citing County Sheriff Dept. data for the Carmelitos Housing development to assert: "My district is safer than it was four years ago." [Mr. Austin took office in mid-July 2012.]
Yesterday (April 5), Councilman Austin sent us an email that he titled "8th district facts," which attached the photo from his Facebook message and stated: "How about reporting the truth?"
[Scroll down for further below.] |
We thanked Councilman Austin for providing the Sheriff Dept./Carmelitos data but challenged him to cite LBPD 8th district crime data to back up his claim regarding the rest of his 8th Council district. Over 24 hours later, Councilman Austin hadn't responded. LBREPORT.com undertook a time consuming process (described below) to analyze LBPD's publicly available 8th Council district crime stats. We publish the results below preceded by background information and methodology. Councilman Austin has represented the 8th Council district since mid-July 2012, a position in which we presume he either knows or should know crime data for his Council district. Since the second half of 2014, he has also been part of the City Council's "Public Safety Committee" giving him opportunities beyond other Councilmembers to address public safety issues in his district and citywide.
For years, LB City Hall routinely released crime data by Council districts, but stopped doing so entering the 2004 election cycle in which two challengers -- Rae Gabelich and Patrick O'Donnell -- ousted two incumbents. Since then, no Councilmembers or Mayors moved to resume the City's previous practice of routinely releasing crime data by Council districts. Despite current talk of innovation and transparency, the City of Long Beach continues to use a primitive method of displaying annual crime totals for the public. It scans hard copy pages of data into pdf form (instead of using spread sheets or other user-friendly digital formats.) The public (and reporters) must first compare a map of Council district borders with a map of LBPD's crime reporting districts, since each LBPD crime reporting district is a small area (usually several neighborhood blocks) and there are multiple LBPD crime reporting districts within each Council district. The public (and reporters) must then hand-transfer figures from lines and columns of figures from multiple crime reporting districts comprising the Council district to derive the Council district's annual crime figures. It is a time consuming, laborious process...and LBREPORT.com used it to prepare this report.
The City's antiquated system for reporting annual crime data to its residents is basically unchanged from the last century. Despite a costly new website, LB's current Mayor and Council (including but not limited to Councilman Austin) have allowed this to persist. LBPD's crime data doesn't list shootings. They are included within the federal bureaucratic category of aggravated assaults (which can include other crimes including spousal abuse, a bar fight with a bottle, etc.) This practice fully complies with federal bureaucratic requirements but it is useless for the public (and reporters) seeking information on shootings. LBREPORT.com inquires nearly daily about shootings and LBPD's PIOs provide the information.
LBREPORT.com has repeatedly described LB as a "tale of two cities" in which some neighborhoods experience violent crimes against persons at levels rarely experienced by other neighborhoods. We have regularly objected to the practice of some city officials of citing only "citywide" crime stats which conceal disparate neighborhood impacts by combining higher and lower crime areas. The 8th Council district is an example of LB's "tale of two cities" and we decline to homogenize or camouflage disparate impacts experienced in parts of the 8th Council district. We separately analyzed areas north of Del Amo Blvd. where some areas experience violent crimes against persons at levels higher than areas to the south, which experience mainly residential and commercial burglaries, auto burglaries and thefts, as well as "petty thefts" (which can involve property of up to $950.) Finally: as we always remind readers in viewing any crime stats: every number corresponds to a real person who became a crime victim. These can be life-affecting, permanently traumatizing experiences. Ask any crime victim. We compared LBPD's publicly available crime stats for 2013 (the first full calendar year in which Councilman Austin held office) with 2015 (the last full year for which LBPD annual crime stats are available.) We acknowledge this doesn't include the first six months of Councilman Austin's term of office (July 2012-Dec. 2012) or the most recent months of 2016. We refer below to what uniform crime reporting data call "Part 1" (serious) crimes against persons and property. They include murder + rape + robbery + aggravated assaults plus residential burglaries + commercial burglaries + auto burglaries + grand theft + petty theft + bicycle theft + auto theft + arson. (Other crimes, considered less serious, are "Part 2" crimes and not analyzed here.) 8th Council district areas north of Del Amo Blvd:
8th Council district areas south of Del Amo Blvd. West of Atlantic Ave.
East of Atlantic Ave. to Orange Ave.
Based on the foregoing, LBREPORT.com is unable to substantiate Councilman Austin's campaign claim that his 8th Council district is "safer than it was four years ago." We continue to invite Councilman Austin to provide data to the contrary. blog comments powered by Disqus Recommend LBREPORT.com to your Facebook friends:
Follow LBReport.com with:
Contact us: mail@LBReport.com |
 Hardwood Floor Specialists Call (562) 422-2800 or (714) 836-7050  |