| (May 27, 2011) -- In a heads-up for summertime LB-area sport fishers and their families, the State Water Resources Control Board's Surface Water Ambient Monitoring Program has released the findings of its largest-ever statewide survey on sport fish from CA coastal waters...which indicates an elevated presence of methylmercury and a high level polychlorinated biphenyls (PCBs) among some fish species along the Long Beach coast.
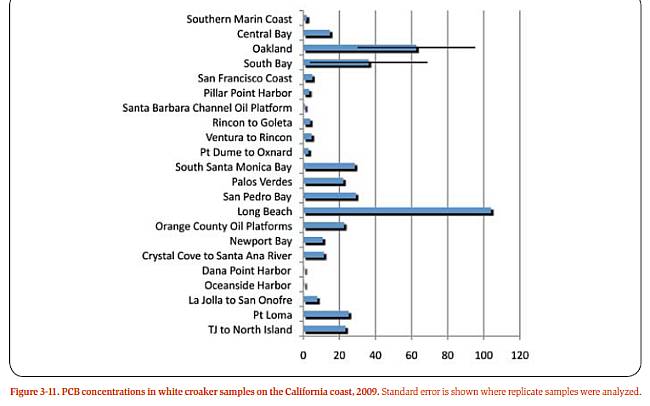
The report, citing 2009 gathered data, indicates that concentations of PCBs in white croaker in the Long Beach area had the highest concentrations of any of the sampled locations statewide.
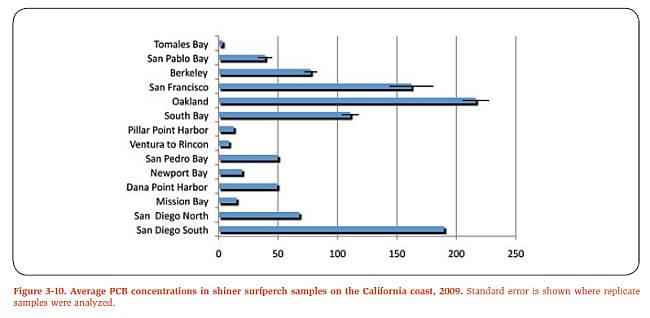
PCB concentrations in shiner surfperch samples weren't among the highest, but were at noteworthy levels.
An agency release accompanying its report says PCBs "may cause cancer, damage the liver, digestive tract, and nerves; and affect development, reproduction, and the immune system. PCBs are persistent chemicals that are now banned, but were commonly used in electrical, industrial and other applications."
Methyl mercury concentrations (in collective species except sharks, which tend to accumulate mercury) were at elevated levels.
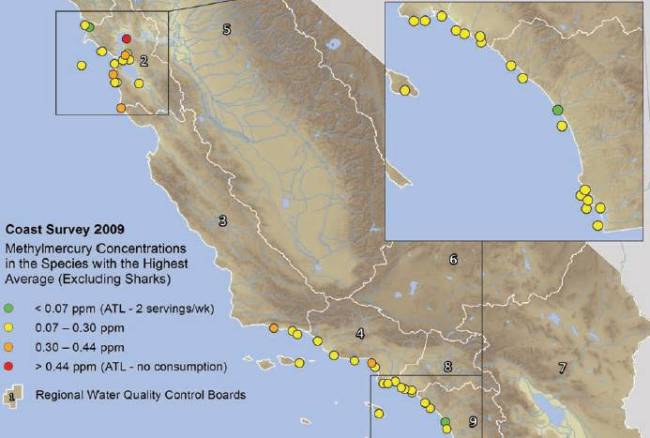
An agency release says methylmercury "can affect the developing nervous system in children and adolescents, potentially leading to learning disabilities. Methylmercury contamination of California coastal waters likely originates from multiple sources, including, historic mercury, gold, and silver mining, regional and global emissions to the atmosphere, and urban and industrial wastewater and stormwater."
Some good news: despite the well-documented DDT dump (now declared Superfund Site) off Palos Verdes, DDT was found at less than the highest levels in LB area waters among sampled species.
The State Water Resources Control Board's report compares PCBs and methylmercury in various fish species to "threshold" levels (ATLs, advisory tissue levels) set by another state agency, the Office of Environmental Health Hazard Assessment, and also describes PCB and methymercury concentrations "spatially" (by location) and by fish species.
LBReport.com highlights some salient local portions of the report below, and also provides a link to the complete report below.
Regarding PCBs:
Comparison to Thresholds
Approximately one-third (36%) of the samples from the Southern California Bight exceeded OEHHA�s
2 serving ATL [Advisory Tissue Level] (21 ppb) for PCBs in this study (Figure 4-4). Average PCB concentrations of fish caught
from embayments exceeded OEHHA�s 1 serving ATL (42 ppb). Average PCB concentrations of fish caught
from open coastal areas exceeded OEHHA�s 2 serving ATL (21 ppb). Average PCB concentrations of fish
caught from the Channel Islands were below the 1 serving ATL. Five samples (3%) exceeded OEHHA�s no
consumption ATL (120 ppb), all of which came from embayment habitats. No samples from the Channel
Islands exceeded the 2 serving ATL (21 ppb).
The lowest average PCB concentration was measured in kelp bass (15 �
13 ppb).
Species that feed on or near sediments, especially those located in embayments (white croaker,
yellowfin croaker, spotted sand bass), had greater concentrations than those species that feed in the water
column along the open coast (kelp bass and Pacific chub mackerel).
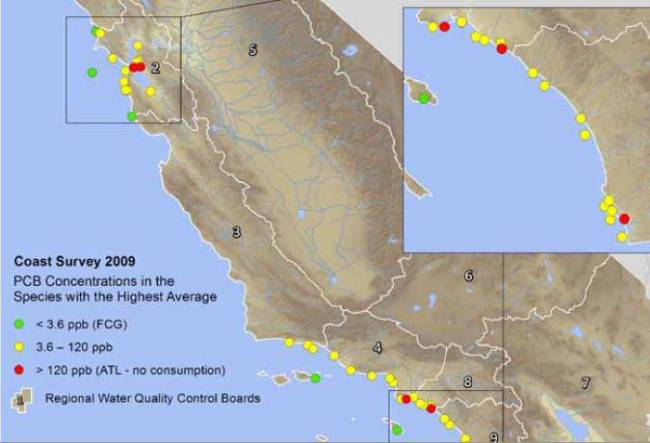
Spatial Patterns
There was a clear spatial trend in PCB concentrations along the open coast of the Southern California Bight
(Figure 4-5). Peak concentrations occurred in fishing locations near the urban centers of Los Angeles and
San Diego. Minimum concentrations occurred in fishing locations distant from urban centers such as Santa
Barbara/Gaviota or south Orange/north San Diego Counties. Four of the 18 fishing locations with kelp bass
samples exceeded OEHHA�s 2 serving ATL (21 ppb); a single location located just north of the US-Mexico
international border exceeded the 1 serving ATL (42 ppb). Five of the 11 fishing locations with white croaker
samples exceeded the 2 serving ATL (21 ppb). Again, samples generally nearest the urban centers of Los Angeles and San Diego had the greatest PCB concentrations. Three of the 17 fishing locations with Pacific
chub mackerel samples exceeded 21 ppb. Yet again, samples generally nearest the urban centers of Los
Angeles and San Diego had the greatest PCB concentrations. Samples furthest from Los Angeles and San
Diego had the lowest average PCB concentrations in Pacific chub mackerel.
Regarding methylmercury:
Comparison to Thresholds
In the Southern California Bight, more samples exceeded fish contaminant thresholds for methylmercury
than any other contaminant for the six species examined in this study (Figure 4-2). Average concentrations
of fish caught in embayments, open coastal areas, and the Channel Islands all exceeded OEHHA�s 1 serving
ATL (0.15 ppm). Six samples (5%) exceeded OEHHA�s no consumption ATL of 0.44 ppm.
Figure 4-2. Concentrations of methylmercury (ppm) in fish composites from three different habitats in the Southern California Bight. Bars represent the average of all species for each habitat. Symbols represent the concentration of each composite sample arranged by species.
Variation Within and Among Species
The average concentration of methylmercury was greater in spotted sand bass (0.16 � 0.04 ppm) than any
other species from the Southern California Bight (Figure 4-2). This was followed by kelp bass (0.15 � 0.05
ppm), white croaker (0.13 � 0.05 ppm), yellowfin croaker (0.10 � 0.10 ppm), and Pacific chub mackerel
(0.06 � 0.03 ppm). Spotted sand bass are the highest trophic position predator sampled in the Bight. In
addition, spotted sand bass prefer embayment habitats known to have greater mercury concentrations in
sediment than offshore habitats (Maruya and Schiff 2009). Kelp bass, which prefer open coastal habitats, are
perhaps the longest-lived of the six species sampled (up to 30 yrs). The combination of high trophic position
and long lifespan are known to contribute to methylmercury accumulation in fish (Wiener et al. 2007). This
likely contributes to the increased average methylmercury concentrations in these species.
Spatial Patterns
There was no clear spatial trend in average methylmercury tissue concentrations along the open coast of the
Southern California Bight (Figure 4-3). Average methylmercury concentrations exceeded OEHHA�s 2 serving
ATL (0.07 ppm) in every one of the 19 fishing locations for kelp bass. Five of the 19 fishing locations also
exceeded OEHHA�s 1 serving ATL (0.15 ppm) for kelp bass, but these were not the locations typically known
for mercury contamination sources. These five locations, which include Point Dume and Point La Jolla, are
headlands with relatively robust kelp bass populations (Pondella et al. in press).
Pacific chub mackerel was the species with the lowest average methylmercury tissue concentrations in this
study. In contrast to kelp bass, Pacific chub mackerel exceeded OEHHA�s lowest threshold, the 2 serving ATL,
in only four of the 19 fishing locations. Like the observations for kelp bass, the fishing locations with the
highest Pacific chub mackerel tissue methylmercury concentrations, places like Gaviota and south Orange
County, are not associated with known sources of mercury.
Regarding DDT:
Comparison to Thresholds
None of the samples from the Southern California Bight exceeded any of OEHHA�s ATLs for DDTs in this
study (Figure 4-6). Average DDT concentrations in fish caught from embayments, open coastal, and channel
island habitats were at least five-fold below OEHHA�s lowest, 2 serving ATL (520 ppb).
To view the full agency report, click here.
Bon appetit.
Share this: 
| |
Return To Front Page
Contact us: mail@LBReport.com
|
 FULL SERVICE Quality Plumbing: Drain Pros serves L.A. & Orange counties. For CURRENT DISCOUNT SPECIALS, CLICK HERE.


 Mike Kowal, Realtor