LBPD reports crime statistics in two categories: "Part 1" crimes and "Part 2" crimes. These are bureaucratic classifications that all U.S. law enforcement agencies follow in reporting crime data to the U.S. Dept. of Justice. Part 1 crimes against persons are murder, manslaughter, forcible rape, robbery, aggravated assault. Part 1 crimes against property include residential and commercial burglary, auto burglary, grand theft, petty theft, bicycle theft, auto theft and arson.
Part 2 crimes include all crimes not included in Part 1 crimes. Part 2 crimes include non-aggravated assaults (fights where no weapon was used or no serious or aggravated injury resulted to the victim); stalking, intimidation, forgery; buying, receiving or possessing stolen property, vandalism, weapons violations, prostitution; drug abuse violations; indecent exposure, statutory rape, DUI, liquor laws, disorderly conduct (incl. disturbing the peace), vagrancy and all other offenses not specifically classified as Part 1 and Part 2 offenses except traffic violations.
Sponsor | Sponsor |
There is no official LBPD or nationally recognized definition for the term "neighborhood" crime as used by Councilwoman Mungo in her candidate statement. All crimes, whether Part 1 or Part 2, are obviously committed in some neighborhood. Whether residents believe "neighborhood crimes" should include the multiple Part 2 crimes we listed above (that Councilwoman Mungo's figure didn't include and mainly increased in the 5th district) is up to residents to decide.
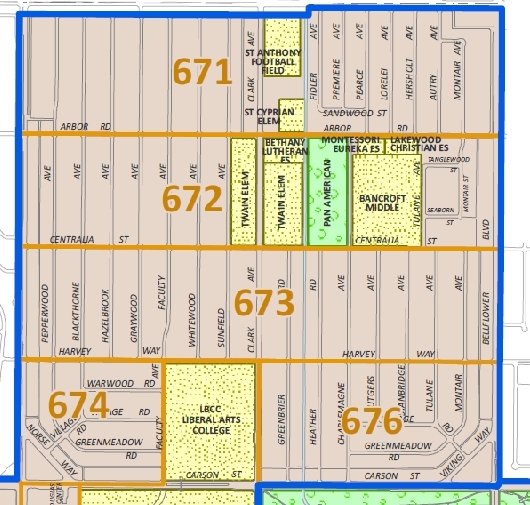
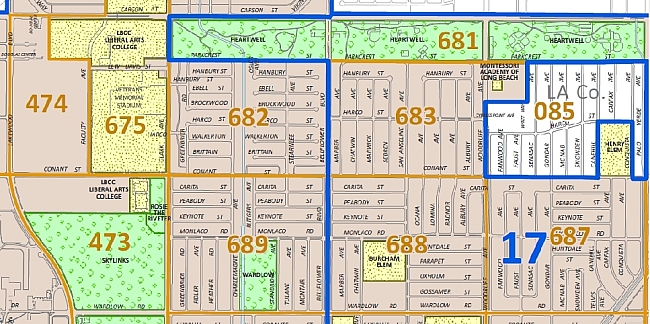
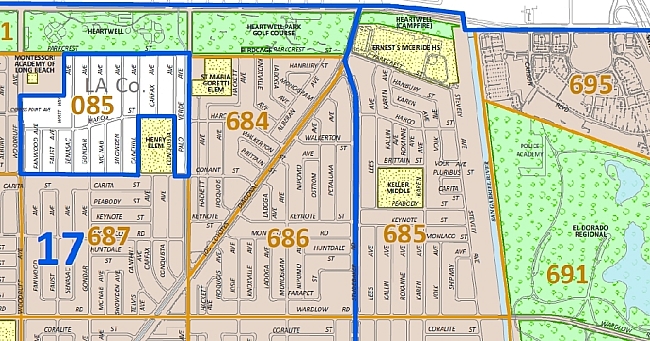
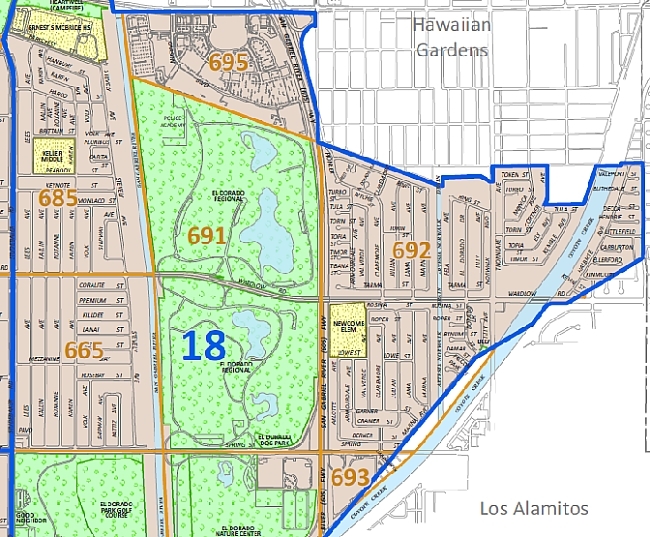
LBREPORT.com provides a detailed geographic breakdown with neighborhood level maps, showing the number of 5th district reported Part 1 crimes against persons plus Part 1 crimes against property as well as Part 2 crimes. The maps display LBPD's "neighborhood reporting districts," relatively small areas to designate where crimes occur for recording purposes. For organizational clarity, we listed LBPD's neighborhood size reporting districts within recognizable (but unofficial) geographic areas.
The data cited below come from LBPD's publicly available crime statistics. They show increases/decreases in Part 1 and Part 2 crimes for 2017 compared to 2016, and for the first four months of 2018 compared to the first four months of 2017.
Sponsor |  |
Sponsor | Sponsor |
 | Sponsor |
LAKEWOOD VILLAGE AREA
PART 2 CRIMES
| District | Jan-Apr 2017 | Jan-Apr 2018 | Change # | Change % |
|---|---|---|---|---|
| 671 | 5 | 12 | +7 | +140.0% |
| 672 | 13 | 16 | +3 | +23.0% |
| 673 | 5 | 7 | +2 | +40.0% |
| 674 | 4 | 8 | +4 | +100.0% |
| 676 | 8 | 14 | +6 | +75.0% |
| District | Jan-Dec 2016 | Jan-Dec 2017 | Change # | Change % |
|---|---|---|---|---|
| 671 | 19 | 23 | +4 | +21.0% |
| 672 | 26 | 31 | +5 | +19.2% |
| 673 | 14 | 27 | +13 | +92.8% |
| 674 | 16 | 15 | -1 | -6.25% |
| 676 | 16 | 24 | +8 | +50.0% |
PART 1 CRIMES
| District | Jan-Dec 2016 | Jan-Dec 2017 | Change # | Change % |
|---|---|---|---|---|
| 671 | 52 | 41 | -11 | -21.15% |
| 672 | 56 | 48 | -8 | -14.28% |
| 673 | 31 | 23 | -8 | -25.8% |
| 674 | 26 | 17 | -9 | -34.6% |
| 676 | 35 | 37 | +2 | +5.7% |
LBCC TO WARDLOW RD AREA
PART 2 CRIMES
| District | Jan-Apr 2017 | Jan-Apr 2018 | Change # | Change % |
|---|---|---|---|---|
| 682 | 00 | 5 | +5 | percentage undefined, five more than zero previously |
| 683 | 6 | 9 | +3 | +50.0% |
| 688 | 2 | 5 | +3 | +150.0% |
| 689 | 2 | 3 | +1 | +50% |
| District | Jan-Dec 2016 | Jan-Dec 2017 | Change # | Change % |
|---|---|---|---|---|
| 682 | 07 | 12 | +5 | +71.4% |
| 683 | 10 | 13 | +3 | +30.0% |
| 688 | 11 | 10 | -1 | -09.0% |
| 689 | 14 | 11 | -3 | -21.4% |
PART 1 CRIMES
| District | Jan-Dec 2016 | Jan-Dec 2017 | Change # | Change % |
|---|---|---|---|---|
| 682 | 19 | 9 | -10 | -52.6% |
| 683 | 22 | 21 | -1 | -4.5% |
| 688 | 17 | 16 | -1 | -5.8% |
| 689 | 15 | 13 | -2 | -13.3% |
WARDLOW RD TO EL DORADO PARK
PART 2 CRIMES
| District | Jan-Apr 2017 | Jan-April 2018 | Change # | Change % |
|---|---|---|---|---|
| 684 | 3 | 1 | -2 | +20% |
| 685 | 4 | 7 | +3 | +15.3% |
| 686 | 2 | 4 | +2 | +1,000% |
| 687 | 4 | 4 | 0 | +0% |
| District | Jan-Dec 2016 | Jan-Dec 2017 | Change # | Change % |
|---|---|---|---|---|
| 684 | 10 | 12 | +2 | +20% |
| 685 | 26 | 30 | +4 | +15.3% |
| 686 | 01 | 11 | +10 | +1,000% |
| 687 | 10 | 21 | +11 | +110% |
PART 1 CRIMES
| District | Jan-Dec 2016 | Jan-Dec 2017 | Change # | Change % |
|---|---|---|---|---|
| 684 | 22 | 13 | -9 | -40.9% |
| 685 | 26 | 33 | +7 | +26.9% |
| 686 | 19 | 16 | -3 | -15.8% |
| 687 | 31 | 22 | -9 | -29.0% |
EL DORADO PARK EAST
PART 2 CRIMES
| District | Jan-Apr 2017 | Jan-Apr 2018 | Change # | Change % |
|---|---|---|---|---|
| 685 | 4 | 7 | +3 | +75.0% |
| 665 | 5 | 5 | 0 | +0% |
| 692 | 14 | 9 | -5 | -35.7% |
| 693 | 0 | 6 | +6 | percentage undefined, six more than zero previously |
| 695 | 20 | 22 | +2 | +10.0% |
| District | Jan-Dec 2016 | Jan-Dec 2017 | Change # | Change % |
|---|---|---|---|---|
| 685 | 26 | 30 | +4 | +15.3% |
| 665 | 10 | 17 | +7 | +70% |
| 692 | 26 | 41 | +15 | +57.7% |
| 693 | 0 | 3 | +3 | percentage undefined, three more than previously |
| 695 | 40 | 57 | +17 | +42.5% |
PART 1 CRIMES
| District | Jan-Dec 2016 | Jan-Dec 2017 | Change # | Change % |
|---|---|---|---|---|
| 685 | 26 | 33 | +7 | +26.9% |
| 665 | 35 | 26 | -9 | -25.7% |
| 692 | 112 | 77 | -35 | -31.25% |
| 693 | 10 | 2 | -8 | -80.0% |
| 695 | 126 | 129 | +3 | +2.38% |
5th DISTRICT CENTRAL-SOUTH (includes Bellflower/Spring & Plaza areas)
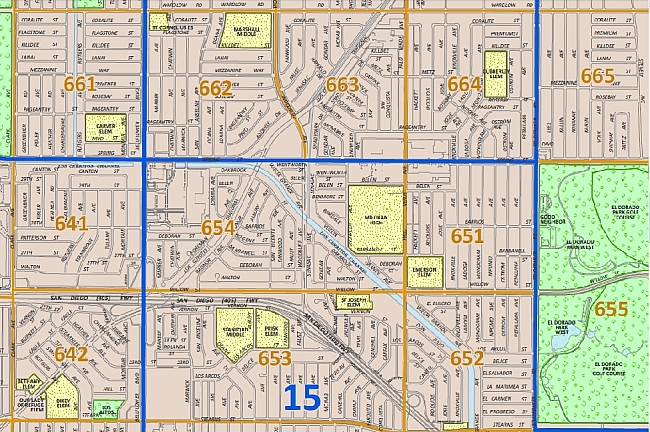
PART 2 CRIMES
| District | Jan-Apr 2017 | Jan-Apr 2018 | Change # | Change % |
|---|---|---|---|---|
| 661 | 5 | 7 | +2 | +40.0% |
| 662 | 5 | 15 | 10 | +200% |
| 663 | 9 | 6 | -3 | -33.3% |
| 664 | 6 | 15 | +9 | +150.0% |
| 665 | 5 | 5 | 0 | +0.0% |
| 641 | 11 | 6 | -5 | -45.4% |
| 642 | 11 | 6 | -5 | -45.4% |
| 651 | 6 | 12 | +5 | +83.3% |
| 652 | 1 | 4 | +3 | +300.0% |
| 653 | 21 | 14 | -7 | -33.3% |
| 654 | 16 | 15 | -1 | -6.25% |
| District | Jan-Dec 2016 | Jan-Dec 2017 | Change # | Change % |
|---|---|---|---|---|
| 661 | 8 | 23 | +15 | +187.0% |
| 662 | 28 | 21 | -7 | -25.0% |
| 663 | 25 | 19 | -6 | -24.0% |
| 664 | 27 | 37 | +10 | +37.0% |
| 665 | 10 | 17 | +7 | +70.0% |
| 641 | 19 | 28 | +9 | +47.3% |
| 642 | 25 | 42 | +17 | +68.0% |
| 651 | 22 | 27 | +5 | +22.7% |
| 652 | 10 | 15 | +5 | +50.0% |
| 653 | 40 | 63 | +23 | +57.5% |
| 654 | 37 | 59 | +22 | +59.4% |
PART 1 CRIMES
| District | Jan-Dec 2016 | Jan-Dec 2017 | Change # | Change % |
|---|---|---|---|---|
| 661 | 33 | 20 | -13 | -39.39% |
| 662 | 111 | 73 | -38 | -34.2% |
| 663 | 36 | 28 | -6 | -16.6% |
| 664 | 27 | 36 | +9 | +33.3% |
| 665 | 35 | 26 | -9 | -25.7% |
| 641 | 50 | 27 | -23 | +46.0% |
| 642 | 28 | 15 | -13 | -46.4% |
| 651 | 38 | 39 | +1 | +2.6% |
| 652 | 30 | 35 | +5 | +16.6% |
| 653 | 113 | 86 | -27 | -23.89% |
| 654 | 112 | 85 | -27 | -24.1% |
| Sponsor | Sponsor |
blog comments powered by Disqus
Recommend LBREPORT.com to your Facebook friends:
Follow LBReport.com with:
RSS |
Contact us: mail@LBReport.com


Hardwood Floor Specialists
Call (562) 422-2800 or (714) 836-7050
