(December 5, 2020, 6:45 a.m., updated 3:20 p.m.) -- The data cited below apply regardless of whom one blames for current COVID conditions and restrictions in Long Beach.
1. The City of Long Beach chart below shows Long Beach's "7 day positivity rate": the percentage of persons who took a COVID-19 test and tested positive for COVID-19 from Oct. 6 through Dec. 4 (source: City of LB digital dashboard.)
2. Long Beach's "7 day" positivity rate is now more than twice as high as it was just weeks ago. That means one's personal risk of encountering someone in Long Beach infected with COVID-19, including asymptomatic individuals capable of unknowingly spreading the virus to others -- is now more than what it was just weeks ago. Oct 21 = 2.8%. December 5 = 7.2% (up from 6.8% the day before.)
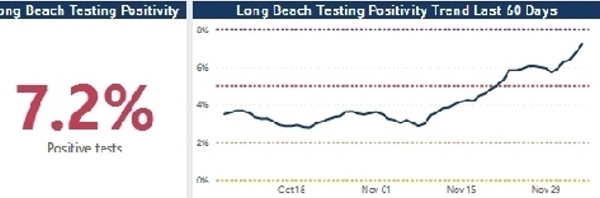
Source: City of LB COVID-19 Digital Dashboard, Dec. 5, 2020
3. Amid rising positivity rates, the "7-day positivity rate" numerically understates the daily rate that LB residents may encounter. Accordingly, on December 3 and 4, LBREPORT.com requested access from LB city management to LB's DAILY positivity rate, showing the most recent DAILY (not "7 day") percentage of LB residents testing positive.
4. On Dec. 4, the City's Joint Information Center said it had communicated our request to city management and it's being considered with a response pending.
5. Distribution of COVID-19 in Long Beach isn't equitable. Residents of working class zip codes in Central LB, West LB and North Long Beach may not have the choice to work from home, or digital equipment to do so. Some have no choice but to interact with others. Some must take public transit. Their zip codes have higher COVID-19 cases per capita than ELB zip codes where many residents can work from home or are retired and can limit their exposure.
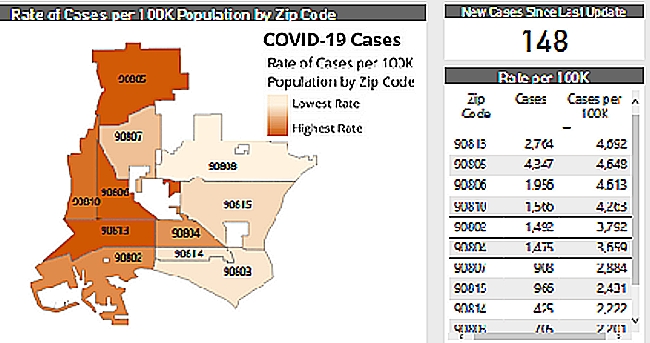
Source: City of LB COVID-19 Digital Dashboard, Dec. 5, 2020
6. If City Hall only has "citywide" data on its daily positivity rate, that data also likely understate the disproportionate COVID 19 positivity in working class zip codes compared to more affluent zip codes.
LBREPORT.com believes the public has the right to know the real daily percentage of residents testing positive for COVID0-19, including its disproportionate impacts if available.
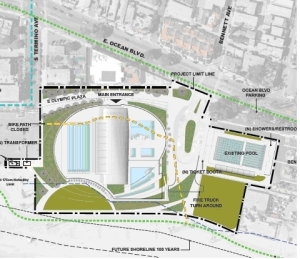 We'll update you when new hearing is scheduled. We’re a group of residents opposed to City Hall building the project just north of beach sand in SE LB because of future sea-level rise (the beach site is expected to flood in 30-50 years), the cost ($82 million, from Tidelands Funds) and the fact that there’s already an existing outdoor pool at this site installed 5 years ago when the old Belmont Pool was demolished in 2015. There are places in Long Beach with a greater need for recreation and sports facilities