LBPD Tells Recent 3rd. Dist. Community Meeting That Crime Is Down; We Compared That To What LBPD's Detailed Crime Stats Show
LBREPORT.com is reader and advertiser supported. Support independent news in LB similar to the way people support NPR and PBS stations. We're not non-profit so it's not tax deductible but $49.95 (less than an annual dollar a week) helps keep us online.
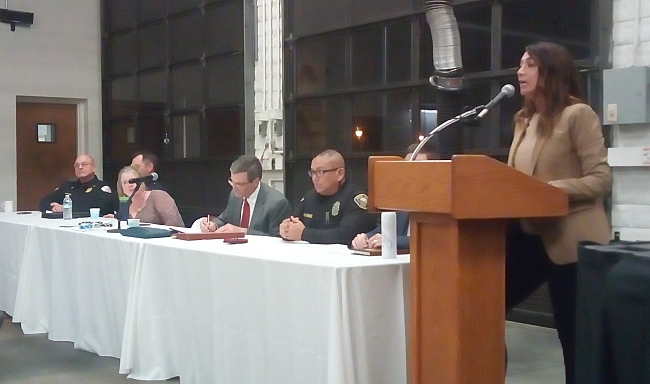
(Feb 4, 2019, 8:45 a.m.) -- Third district Councilwoman Suzie Price (who chairs the City Council's Public Safety Committee) held a January 29, 2019 community meeting on issues ranging from homelessness to crime.
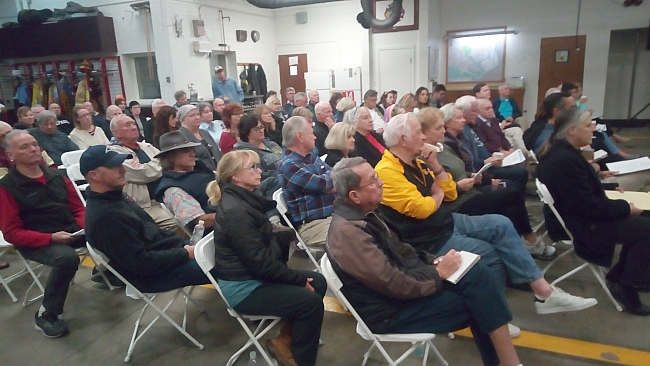
Nearly 100 residents attended the meeting at Fire Station 14.
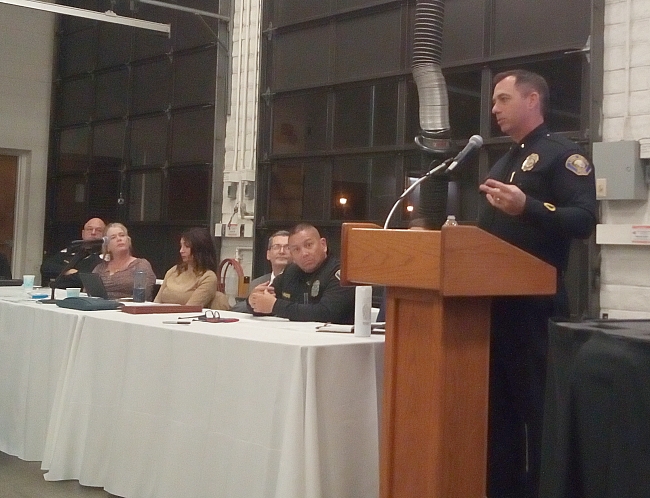
LBPD East Division Commander Patrick O'Dowd. delivered a Power Point presentation that cited LBPD crime stats for Part 1 (serious) crimes against persons and property "citywide" and in LBPD's East Division.
[Scroll down for further.]
Commander O'Dowd stated in pertinent part:
Commander O'Dowd: ...So these are the official numbers...Violent crime, Part 1 crimes in the city overall, down 16.5% from last year, that's pretty significant. And the property crimes of course, [down] 6.4 [%] so that's for the city as a whole. And then we narrow it down to East Division and it gets even better. So violent crimes are down 22.4% compared to last year and property crimes down 6.7 [%]. So that's pretty good...[T]hat's pretty significant and it's nice to be able to report that...Part 1 violent crimes are the most serious violent crimes so there are some violent crimes that aren't included in Part 1 but these are the aggravated assaults, robberies, rape, murder: everything's down. And then we have our property crimes for East Division: again, everything's down but significantly the residential burglaries and the auto burglaries actually ticked up [column showing increase is blank] and I didn't not put a number because it was a positive number, it's just, it wasn't even 1%...
Sponsor
Sponsor
When Commander O'Dowd said crime is "down," we saw some people in the audience quietly shaking their heads "no." After the meeting, some of them told us they don't believe what they heard. LBREPORT.com decided to compare what residents heard with what LBPD's detailed neighborhood-level crime stats show.
Sponsor
LBPD's East Division encompasses LB's 3rd, 4th and 5th Council districts, a fact Commander O'Dowd acknowledged by displaying a map in his presentation. (It also means that the crime stats presented at the meeting pertain to a wide area roughly 2/3 of which is outside the Third Council district.)
LBREPORT.com cites below publicly available crime stats from LBPD neighborhood-size crime reporting districts. LBPD makes these figures available on its webpages but does so in hard-copy-scanned pdf form instead of a more user-friendly spread-sheet format, which makes the figures time consuming for residents (and reporters) to break down in detail.
Sponsor
Sponsor
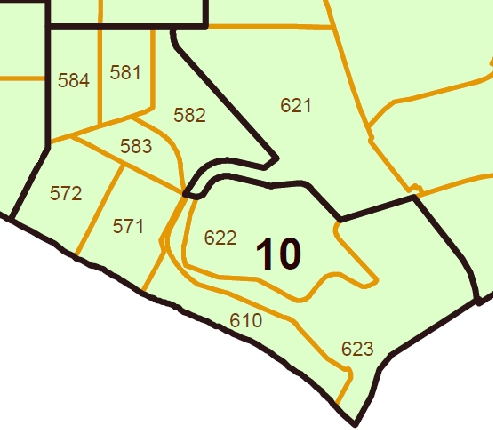
We chose at random a portion of the 3d district bordered on the west by Ximeno Ave, on the north by Colorado St., on the east by PCH, and on the south by the Pacific Ocean. For further detail, we used 2nd St. (and Sorrento Dr. on the north side of Naples) as a north-south dividing line. The area south of 2nd St,/Sorrento encompasses Belmont Shore-Naples-the Peninsula (LBPD dists. 571, 572, 610, 622, 623.) The area north of 2nd St./Sorrento basically covers adjacent neighborhoods northward and eastward (LBPD dists.581, 582, 583, 584, 621). We provide an orienting map below.
LBREPORT.com reports below what LBPD's Jan 1-Dec. 31, 2018 publicly released crime stats show for the areas.indicated. Part 1 crimes (totaled and abbreviated below as "P1") are murder, manslaughter, rape, robbery, aggravated assaults, burglaries (residential, comm'l, auto), larceny thefts (grand, petty, auto, bike) and arson. Part 2 crimes (totaled and abbreviated below as "P2") are all other crimes that aren't Part 1 crimes. Part 2 crimes include those that Councilwoman Price has called "quality of life" crimes (acknowledging their impacts on neighborhood residents.) LBREPORT.com is unable to report specific types of Part 2 crimes because LBPD crime stats don't itemize them; they simply display a totaled number of all Part 2 crimes within specific geographic areas.
Increases are in red font; decreases are in green. LBREPORT.com invites our readers to compare what was said at Councilwoman Price's community meeting with what LBPD detailed crime stats for these areas show. They speak for themselves.
While total crimes were down, some crimes were up and have reached noteworthy levels. In 2018: 21 res burgs (up from 14). 13 grand thefts (averaging more than one a month) and 29 petty thefts (up from 19)
The numbers above may or may not reflect conditions elsewhere in the Third Council district or in LBPD's broader East Division. LBREPORT.com has repeatedly noted that crime stats covering large areas like East Division or "citywide" (the latter quoted by Mayor Garcia in his recent "State of the City" message) may be numerically accurate for those broad areas but may not reflect conditions experienced by residents in their neighborhoods.
Commander O'Dowd also discussed LBPD staffing. LBREPORT.com will analyze that portion of his presentation in a separate article. Further to follow.
Support really independent news in Long Beach. No one in LBREPORT.com's ownership, reporting or editorial decision-making has ties to incumbent Long Beach officials, development interests, advocacy groups or other special interests; or is seeking or receiving benefits of City development-related decisions; or holds a City Hall appointive position; or has contributed sums to political campaigns for Long Beach incumbents or challengers. LBREPORT.com isn't part of an out of town corporate cluster and no one its ownership, editorial or publishing decisionmaking has been part of the governing board of any City government body or other entity on whose policies we report. LBREPORT.com is reader and advertiser supported. You can help keep really independent news in LB similar to the way people support NPR and PBS stations. We're not non-profit so it's not tax deductible but $49.95 (less than an annual dollar a week) helps keep us online.