LBReport.com

News / Analysis / Perspective

Crime Stats For Grownups: Initial Review: City Says Crime Stats Show Crime Is "Down," But Here's What It Doesn't Say But Should


LBREPORT.com is reader and advertiser supported. Support independent news in LB similar to the way people support NPR and PBS stations. We're not non-profit so it's not tax deductible but $49.95 (less than an annual dollar a week) helps keep us online.
(Jan. 10, 2019, 10:50 p.m.) -- At late afternoon Thursday (Jan. 10), the City of Long Beach issued a press release headlined "Crime Continues To Decrease In Long Beach." To view the release in full, click here.

LBREPORT.com's initial analysis follows below.

News stories are supposed to provide the "what" and the "where." So "what" crimes are listed and "where" in LB were they committed?

  • LBPD Crime Stats Fail To Detail Entire Category Of Multiple Neighborhood-Impacting And (Council-Labeled) "Quality of Life" Crimes: City of LB crime stats list categories of "Part 1" crimes, the most serious crimes against persons (murder, manslaughter, forcible rape, robbery, aggravated assault) and related to property (residential and commercial burglary, auto burglary, grand theft, petty theft, bicycle theft, auto theft and arson.)

    But they don't identify or similarly list Part 2 crimes (all other neighborhood-impacting crimes. Part 2 crimes include multiple categories of neighborhood impacting-crimes including non-aggravated assaults (no weapon, no serious/aggravated injury), forgery; buying/receiving/possessing stolen property, vandalism, weapons violations, prostitution; drug abuse violations; indecent exposure, statutory rape, DUI, liquor laws, disorderly conduct (incl. disturbing the peace), vagrancy and everything else except traffic violations.

    LBPD crime stats don't detail Part 2 crimes. They omit specifying crimes impacting multiple neighborhoods, described by Councilmembers (including LBPD Public Safety Committee chair Suzie Price) in discussing vagrant/homeless related crimes.

    For 2018, LBPD says Part 2 crimes as group dropped citywide from 17,236 to 16,427, a decrease citywide of 4.7% (visible at this link, p. 9.) But in its currently displayed form, one can't tell what Part 2 crimes may have increased while others decreased or where in LB those increases or decreases occurred.

    Some Part 2 crimes vary considerably and include vagrant-related "quality of life" crimes (such as a mentally ill person urinating in public ) LBREPORT.com acknowledges that other police agencies routinely combine Part 2 crimes, but in our view, Long Beach shouldn't do so when the City Council has noted the neighborhood impacts of homeless/vagrant related "quality of life" crimes.

    [Scroll down for further.]


  • Pages 1-9 of at this link show the number of Part 2 crimes as a group reported in neighborhood-size crime reporting districts, but because they're not identified by the type of crime, one can't tell what types of crime(s) were committed.

  • Long Beach had an increase of 36.4% increase in its murders in 2018, which it tries to downplay by calling the 30 murders "comparable to the current five-year (2014-2018) average of 29." The truth is LB had a 2017 record low of 22 and the one year increase to a total above its five year average is noteworthy.

    Sponsor

    Sponsor

  • LB's crime stats don't show "where" murders occurred by Council districts. LBREPORT.independently tracked that information for 2018 and displays it below.
    Elective districtIncumbent2018 Homicides
    Citywide
    Mayor Garcia
    30
    Dist. 1
    Gonzalez
    11
    Dist. 6
    Andrews
    7
    [One 2018 crime scene = 2 deceased]
    Dist. 8
    Austin
    5
    [One 2018 crime scene = 2 deceased]
    Dist. 9
    Richardson
    3
    Dist. 2
    Pearce
    2
    Dist. 7
    Uranga
    1
    Dist. 5
    Mungo
    1

    Sponsor


  • LBPD recalculated aggravated assaults in 2018. The result now shows a 16.6% decrease in aggravated assaults citywide (from 1,637 in 2017 to 1,366 in 2018.) In a December 13, 2018 press release, LBPD stated:

    Beginning early in 2018, the Police Department initiated a review of all aggravated assault incidents to identify the cause of a notable increase in the number of aggravated assaults. During this review, the department was unable to immediately determine any unusual contributing factors. After adjustment of review parameters, which included analysis of actual report narratives, it was discovered that a significant number of incidents had been misclassified as aggravated assaults, instead of simple assaults. These misclassifications were a result of data entry coding errors when reports were being electronically filed, and when reviewed for categorization...With this review, we anticipate seeing a decrease in aggravated assaults and an increase in simple assaults in the 2018 year-end crime statistics...

    (LBREPORT.com is in the process pursuing this aspect of LB's 2018 crime stats separately.)

    Sponsor

    Sponsor

  • LB crime statistics don't show crimes by Council districts LBPD used to routinely show crime stats by Council districts but ended the practice entering the 2004 election cycle. Since then, no Council incumbents have sought to change this..

  • LB's crime stats don't show shootings. LBPD includes shootings within the general category of "aggravated assaults." This complies with federal bureaucratic crime reporting rules, but makes it useless for Long Beach residents. In contrast, LAPD crime stats have specific line items showing "shooting victims" and "shots fired." LAPD crime stats can be viewed at this link. Long Beach crime stats don't include this information.

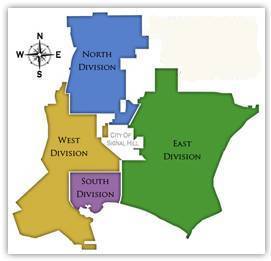
    LBPD displays Part 1 crimes by its 5 divisions (North, South, East & West + Port). It shows Part 1 crimes "citywide" (all five divisions combined) and for each of the five LBPD divisions separately at this link.

    Although the City of Long Beach says it practices an "open data" policy and Mayor Garcia says he's "data driven," LBPD provides its crime statistics in a user-unfriendly digital format although we believe they could be made available in a user-friendly spread sheet format (which we presume LBPD uses internally.)

    That's our initial review. Further from LBREPORT.com on LB's 2018 crime stats to follow.


    Support really independent news in Long Beach. No one in LBREPORT.com's ownership, reporting or editorial decision-making has ties to incumbent Long Beach officials, development interests, advocacy groups or other special interests; or is seeking or receiving benefits of City development-related decisions; or holds a City Hall appointive position; or has contributed sums to political campaigns for Long Beach incumbents or challengers. LBREPORT.com isn't part of an out of town corporate cluster and no one its ownership, editorial or publishing decisionmaking has been part of the governing board of any City government body or other entity on whose policies we report. LBREPORT.com is reader and advertiser supported. You can help keep really independent news in LB similar to the way people support NPR and PBS stations. We're not non-profit so it's not tax deductible but $49.95 (less than an annual dollar a week) helps keep us online.


    blog comments powered by Disqus

    Recommend LBREPORT.com to your Facebook friends:


    Follow LBReport.com with:

    Twitter

    Facebook

    RSS

    Return To Front Page

    Contact us: mail@LBReport.com


  • Adoptable pet of the week:


    Carter Wood Floors
    Hardwood Floor Specialists
    Call (562) 422-2800 or (714) 836-7050


    Copyright © 2018 LBReport.com, LLC. All rights reserved. Terms of Use/Legal policy, click here. Privacy Policy, click here