2018 Crime Stats For Grownups: See ELB/Lakewood Village Norse Way/Viking Way & Nearby Neighborhood Details; You Decide: Is Crime "Up" Or "Down?" Is That The Right Question?
LBREPORT.com is reader and advertiser supported. Support independent news in LB similar to the way people support NPR and PBS stations. We're not non-profit so it's not tax deductible but $49.95 (less than an annual dollar a week) helps keep us online.
(Jan. 11, 2019, 9:20 a.m.) -- On Jan. 4, 2019, 5th district Councilwoman Stacy Mungo sent a mass emailing of her periodic "Neighborly News" stating in part: "Year over year reduction in crime for East Division by 8%."
Six days later, LBPD released 2018 crime stats showing (as we predicted) that this is true for Part 1 crimes at this link. But as we also pointed out: (1) "East Division" doesn't equal the "5th Council district"; it incudes three Council districts: 3+4+5; and (2) The figure doesn't include all Part 2 crimes, including non-aggravated assaults (no weapon used or no serious or aggravated injury); stalking, buying/receiving/possessing stolen property, vandalism, prostitution; drug abuse; indecent exposure, DUI, liquor laws, disorderly conduct (incl. disturbing the peace) and vagrancy. LBPD detailed crime stats on this link, p. 9. show Part 2 crimes decreased 4.7% citywide in 2018 compared to 2017.
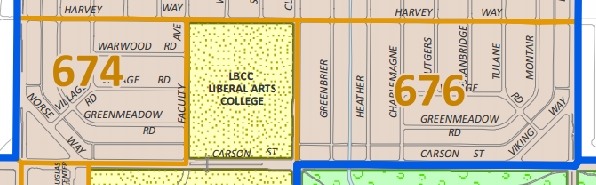
So what about details for 5th district areas? LBREPORT.com randomly chose for analysis the quiet neighborhoods that include the Lakewood Village Norse Way (west of Bellflower Blvd.) and Viking Way (east of Lakewood Blvd.) shopping areas (flanking LBCC's ELB campus.) Each area has its own LBPD crime reporting district: 674 for Norse Way and vicinity, 676 for Viking Way and vicinity (see map below.)
So...would you say crimes in this part of ELB are "up" or "down"? And is that the right question? The Norse Way area had only eight more "Part 1" crimes in 2018 than 2017...BUT that included ten commercial burglaries in 2018 -- an average of one per month -- when a year earlier, there was only one for the entire year.
And the nearby residential neighborhoods reported 4 and 6 residential burglaries in 2018 (ten combined, the same number as commercial burglaries) -- at an average rate a residential burglary every 60 to 90 days within relatively small residential areas of a few blocks.
Because Long Beach doesn't provide its crime stats in user-friendly spread sheet form, the City makes this level of analysis time consuming and burdensome for residents and the media.
Sponsor
Sponsor
And these numbers don't detail Part 2 crimes; they're simply lumped together as group; they dropped citywide in 2018 compared to 2017 from 17,236 to 16,427 (visible at this link, p. 9.) However one can't tell what specific Part 2 crimes may have increased or decreased or stayed the same. Part 2 crimes vary considerably, and include vagrant-related "quality of life" crimes (such as a mentally ill person urinating in public ) LBREPORT.com acknowledges that other police agencies routinely combine Part 2 crimes, but in our opinion, Long Beach should provide a greater level of detail, especially when the City Council (in discussing homeless related issues) has noted the neighborhood impacts of homeless/vagrant related "quality of life" crimes.
Sponsor
Sponsor
Sponsor
Sponsor
Sponsor
Support really independent news in Long Beach. No one in LBREPORT.com's ownership, reporting or editorial decision-making has ties to incumbent Long Beach officials, development interests, advocacy groups or other special interests; or is seeking or receiving benefits of City development-related decisions; or holds a City Hall appointive position; or has contributed sums to political campaigns for Long Beach incumbents or challengers. LBREPORT.com isn't part of an out of town corporate cluster and no one its ownership, editorial or publishing decisionmaking has been part of the governing board of any City government body or other entity on whose policies we report. LBREPORT.com is reader and advertiser supported. You can help keep really independent news in LB similar to the way people support NPR and PBS stations. We're not non-profit so it's not tax deductible but $49.95 (less than an annual dollar a week) helps keep us online.