No one in LBREPORT.com's ownership, reporting or editorial decision-making has ties to development interests, advocacy groups or other special interests; or is seeking or receiving benefits of City development-related decisions; or holds a City Hall appointive position; or has contributed sums to political campaigns for Long Beach incumbents or challengers. LBREPORT.com isn't part of an out of town corporate cluster and no one its ownership, editorial or publishing decisionmaking has been part of the governing board of any City government body or other entity on whose policies we report.
LBREPORT.com is reader and advertiser supported. Support independent news in LB similar to the way people support NPR and PBS stations. We're not non-profit so it's not tax deductible but $49.95 (less than an annual dollar a week) helps keep us online.
A version of this story by the author previously appeared in the Beachcomberat this link. The text below is updated to reflect recent developments.
(Jan. 29, 2021, 7:40 a.m.) -- On January 12, 2021, Long Beach Mayor Robert Garcia delivered a "State of the City" message that never once acknowledged increases in serious 2020 LB crimes. The City's website tab to City press releases doesn't mention LB's 2020 crime stats because there was no city release on LB's 2020 crime stats. A less conspicuous release appears on LBPD's webpage. It doesn't quote Garcia, a deliberate omission protecting him from Google searches on the topic. (It contrasts with City Hall's practice of routinely quoting Garcia in releases even if he had no meaningful role in their subject matter.)
In previous years, LBPD crime stat releases quoted Garcia and his predecessors when they showed improvements...but that didn't happen in 2020.
LBPD's release cites a small "overall" decline in violent crime (1.4%) using citywide stats that dilute disproportionate impacts in LB's working class neighborhoods...but specific crime categories are bad. The release cites them by percentages only; 5.9% increase in murders. 18.6% increase in aggravated assaults.
And incredibly: the word "gangs" never appears in LBPD's release, a quiet verbal censorship that undermines the release narrative's credibility.
Property crimes also up 12.1%, a majority from a 28.9% increase in auto burglaries, a 26.2% increase in commercial burglaries, a 22.6% in garage burglaries, and a 21.4% increase in grand theft auto.
A common management principle teaches that if you don't measure a problem, you can't correct it.
So how many of Long Beach's most serious crimes (labeled "Part 1 crimes" against persons and property) did your Council district, and others, have in 2020? In what types of crimes? The City's crime stats don't show this (although they used to.)
What types of "quality of life" neighborhood impacting crimes (from porch thefts to sawing off catalytic converters ) victimized LB neighborhoods and where? (These crimes aren't itemized leaving residents unable to tell where they occurred.)
How many shootings did Long Beach have in 2020 and in what Council districts were they? They're not listed in Long Beach's official crime statistics; (They're concealed within another crime category.)
These data gaps can be corrected by the City Council. Thus far, no Council incumbents have moved to do so.
[Scroll down for further.]
e
Numerically and geographically sanitized
Unmentioned murder numbers Long Beach had 36 murders in 2020, up from 34 in 2019. That's the highest number since 2015 and higher than LB's five year average of 31. These numbers are completely omitted in LBPD's release narrative (which simply cites a percentage increase.) And they don't show that LB's murders disproportionately impact working class neighborhoods, an "tale of two cities" inequity experienced by families and businesses in parts of Central Long Beach and North Long Beach
Sponsor
Sponsor
Sponsor
Sponsor
.
Censored crime stats by Council districts. For years, LB release crime stats by Council districts. These included "Part 1" (serious) crimes against persons (murder, manslaughter, forcible rape, robbery, aggravated assault) and property (residential and commercial burglary, auto burglary, grand theft, petty theft, bicycle theft, auto theft and arson.)
This was powerful data but embarrassing to some incumbents in higher crime council districts. In the final years of Mayor O'Neill's administration, city management stopped releasing data showing crimes by Council districts. The matter wasn't debated by the policy-setting City Council; it was simply implemented. In a flimsy excuse, LHPD noted that in a few parts of town, LBPD crime reporting districts crossed Council district lines, which was true, and said tjhis made data in those few areas unreliable (undertain which Council district the crime occurred) which was untrue. In those few areas, LBPD obviously knew the location of the crimes and could assign them to the proper Council district.
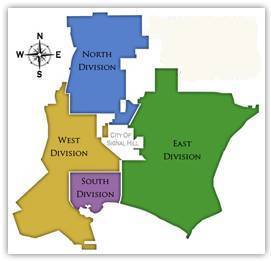
Today, the City of Long Beach provides crime stats by LBPD Divisions (North, South, East, West.) These obviously cross Council district lines. They are even less reflective of individual neighborhood realities. LBPD's East Division spans 5th district suburban areas to western 4th district areas (in recent months plagued by shootings) to wealthy 3rd district enclaves.
The only other way for the public and press to "reconstruct" crime stats by Council district is to laboriously enter crime numbers from multiple neighborhood size crime reporting districts comprising each Council district. LBPD makes this task more difficult by listing neighborhood numbers in primitive hard copy pdf form instead of in useful digital form (which LBPD obviously has.)
Part 2 crimes aren't itemized...not even those frequently termed "quality of life" crimes. They include non-aggravated assaults, buying, receiving or possessing stolen property, vandalism, weapons violations, prostitution; drug abuses; indecent exposure, liquor laws, disorderly conduct, vagrancy and other offenses. The Council could direct LBPD to pull out and itemize especially problematic Part 2 crimes (porch thefts and catalytic converter thefts come to mind) but the Council hasn't done so. (Bike thefts are already itemized among Part 1 crimes.)
Crime stat data gaps invite fog from some Council incumbents. In her official 2018 candidate ballot statement, 5th dikst. incumbent Councilwoman Stacy Mungo told voters "we have...decreased neighborhood crime by 18.4% and citywide crime by 11.4%" and reiterated part of that statement in at least two mailers in her runoff campaign: ("brought neighborhood crime down 18%" and [in a statement her campaign attributes to Mayor Garcia] "lowered our crime rate by 18%," a quoted attributed to Mayor Garcia.)
There is no official LBPD or nationally recognized definition for the term "neighborhood" crime (all crimes, whether Part 1 or Part 2, obviously affect some neighborhood.) Councilwoman Mungo appears to have lifted figures from LBPD's East Division Part 1 crimes against property and portrayed them as 5th district data, which was inaccurate. Her cited 18.4% figure reflected all of East Division and thus included areas not within the 5th Council district but within Council districts 3 and 4. Her claim to have "reduced...citywide crime by 11.4%" appears to have been similarly lifted from citywide Part 1 crimes against property (although listed in LBPD's summary as 11.3%.) (For the record, LB's total number of crimes citywide (Part 1 + Part 2) in 2017 decreased from 2016 by 3.6%. )
Censored crime stats on shootings: Long Beach crime stats don't list shootings..
With the tacit approval of its policy-recommending Mayor and policy-setting City Council, LBPD crime stats don't disclose the number of non-police-involved shootingsor their location(s). Long Beach's practice contrasts with the City of Los Angeles where LAPD shows the number of shootings -- with separate line items for "shots fired" and "shooting victims" AND their increases/decreases And their local division (geographic) locations -- in its routinely released crime stats.
In terms of transparency and detail for its taxpaying residents and businesses, LAPD's practice puts Long Beach to shame.
LAPD provides access to these shooting details in its crime stats citywide at this link. On the same page, it provides links to the data for EACH of LAPD's geographic divisions.
In contrast, Long Beach Police Department crime stats display NO shootings.
LBPD (operating under the City Manager who answers to the City Council) does what many local law enforcement agencies do,. LBPD includes shootings among "aggravated assaults," a collective category that can range from a bar fight with one party wielding a table fork to a near fatal shooting. LB's practice satisifies federal crime compiling bureaucrats but leaves LB taxpayers and neighborhood groups in the dark on non-police-involved shootings,
Nothing prevents LBPD from displaying the shooting details that LAPD does: shots fired, shooting victims and their general locations (in LB;s case by Council districts.)
Long Beach crime stat data gaps are especially relevant given the City Council's Sept. 2020 vote to defund nearly 50 sworn officers on top of 180+ officers erased but not restored in 2009-2015 budget-driven police defundings (that eliminated LBPD's former field anti-gang unit.).
LB's crime scene data gaps can be fixed. The City Council's "Public Safety Committee" could agendize them for discussion and recommendations for change to the City Council. So could any other Council incumbent(s).
Sponsor
Support really independent news in Long Beach. No one in LBREPORT.com's ownership, reporting or editorial decision-making has ties to development interests, advocacy groups or other special interests; or is seeking or receiving benefits of City development-related decisions; or holds a City Hall appointive position; or has contributed sums to political campaigns for Long Beach incumbents or challengers. LBREPORT.com isn't part of an out of town corporate cluster and no one its ownership, editorial or publishing decisionmaking has been part of the governing board of any City government body or other entity on whose policies we report. LBREPORT.com is reader and advertiser supported. You can help keep really independent news in LB similar to the way people support NPR and PBS stations. We're not non-profit so it's not tax deductible but $49.95 (less than an annual dollar a week) helps keep us online.


 Today, the City of Long Beach provides crime stats by LBPD Divisions (North, South, East, West.) These obviously cross Council district lines. They are even less reflective of individual neighborhood realities. LBPD's East Division spans 5th district suburban areas to western 4th district areas (in recent months plagued by shootings) to wealthy 3rd district enclaves.