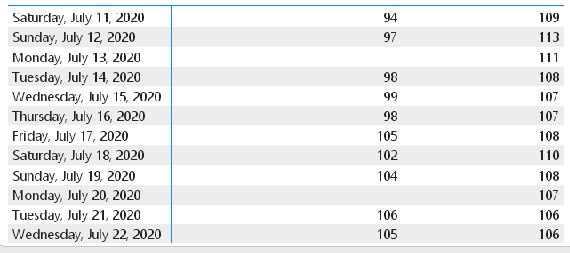
It's a bit of good news but requires context; LB's double-digit "positivity rate" remains significantly higher than L.A. County's positivity rate (8.4%/7 day average) and CA's positivity rate statewide (about 7%).
Simply put: LB's double-digit positivity rate means the virus is circulating at concerning high levels in LB.
LB's citywide positivity number also deserves context because a separate metric -- the number of COVID-19 cases in LB -- shows cases aren't distributed anywhere near equally citywide. The number of COVID-19 cases per capita in some LB zip codes is double to nearly triple that of others.
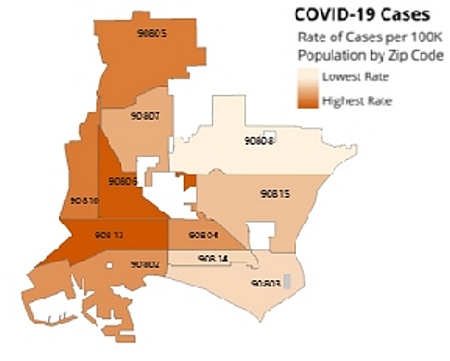
[Source: City of LB COVID-19 dashboard]
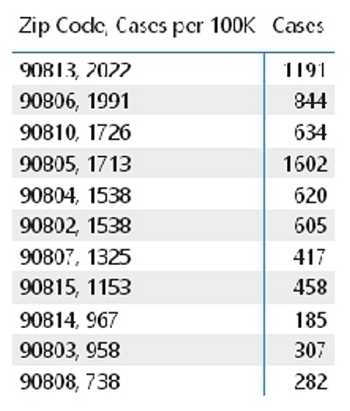
[Source: City of LB COVID-19 dashboard]
[Comment: LBREPORT.com can't prove but suspects this medical inequality reflects an economic inequality: working class residents may rely on jobs requiring their presence outside their homes; others also rely on public transit, both factors increase their likelihood of exposure.]


The above ad space donated by LBREPORT.com