LBReport.com

News

RAND Researchers Offer This Interactive Tool To See Estimated CA COVID-19 Deaths, Confirmed Cases, Reduced State Income And More If Current Restrictions Maintained Or Removed, And In What Amounts And When


If LBREPORT.com didn't tell you,
who would?
No one in LBREPORT.com's ownership, reporting or editorial decision-making has ties to development interests, advocacy groups or other special interests; or is seeking or receiving benefits of City development-related decisions; or holds a City Hall appointive position; or has contributed sums to political campaigns for Long Beach incumbents or challengers. LBREPORT.com isn't part of an out of town corporate cluster and no one its ownership, editorial or publishing decisionmaking has been part of the governing board of any City government body or other entity on whose policies we report.

LBREPORT.com is reader and advertiser supported. Support independent news in LB similar to the way people support NPR and PBS stations. We're not non-profit so it's not tax deductible but $49.95 (less than an annual dollar a week) helps keep us online.
Long Beach COVID-19 Cases / Deaths
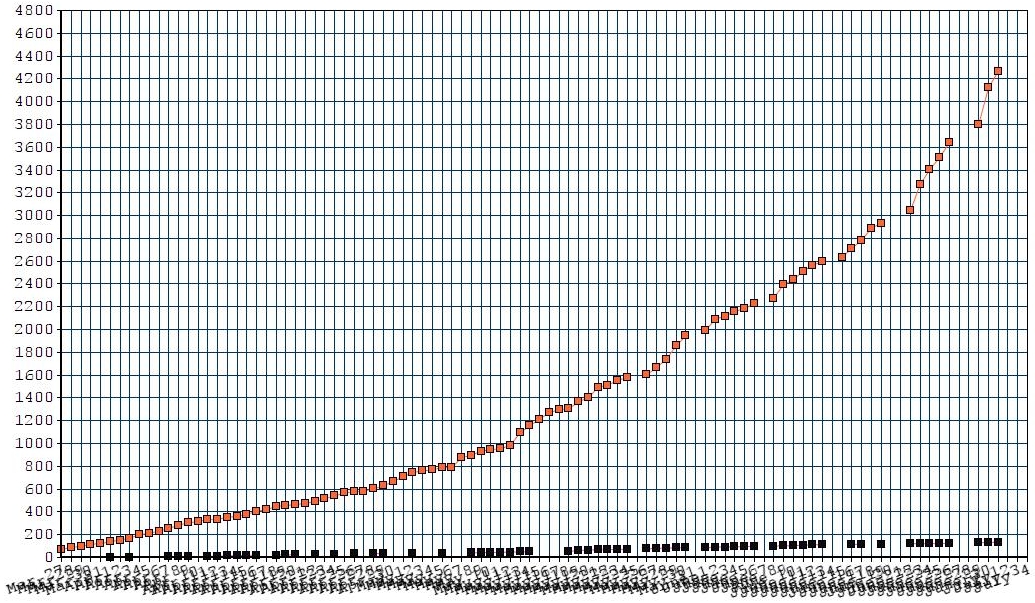
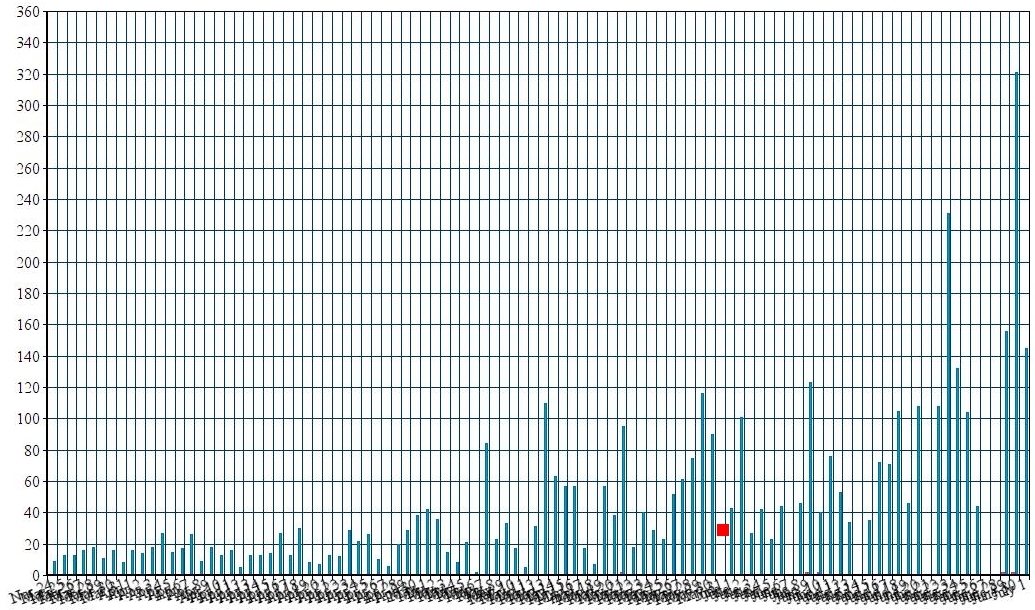
Total positives (red dots) and deaths (black dots)

Daily reported positive cases

Fast Face Mask: With Bandana/Woven Cloth + 2 Rubber Bands
(May 10, 2020, 9:50 p.m.) -- RAND researchers have created an online interactive tool offering estimates of both the public health and economic effects in every state of rolling back or maintaining COVID-19 restrictions. The findings suggest that, while states that relax these policies now can expect economic improvements, they're also likely to see higher numbers of cases and deaths by September, as well as rebounds in demand for beds in hospitals and intensive care units. (LBREPORT.com did so for California, below.)

RAND says its tool "draws on an epidemiological model and an economic model to estimate effects, based on evidence from past epidemics, peer-reviewed literature, and data from the current pandemic. Data on current impacts are updated daily where available." Its key Findings

States that relax intervention measures in early May can expect to see:

  • higher projected cases and deaths by September 1

  • rebounds in patient numbers for hospitals and intensive care units

  • rebounds that come sooner and can be more severe the further restrictions are relaxed

  • greater improvements in the economy the more restrictions are relaxed.

States that relax restrictions from June 1 can expect to see

  • smaller increases in cases and deaths by September 1, compared with opening sooner

  • patient numbers for hospitals and intensive care units rebound later and at lower numbers

  • smaller improvements in economic indicators.
  • "Some states, such as New York, may have passed their highest peaks in active cases and hospitalizations, but for most, the worst is yet to come. Strict social distancing measures can delay this peak but cannot eliminate it without better treatments or a vaccine. In states with high case numbers, drastically reducing social distancing can increase cases to unmanageable levels. The lag between reopening and the hospitalization spike can make this difficult to observe until it is too late."

    The interactive model allows one to change restriction levels and applicable change dates. We first compared removing all of CA's restrictions (except closed schools) as of May 15 (some have come close to advocating this) versus maintaining CA's maximum restrictions through June 13. (The online tool automatically removes restrictions 30 days after the date they're imposed.)

    [Scroll down for further.]


    The above ad space donated by LBREPORT.com


    The RAND interactive tool indicates if California immediately removed its maximum restrictions (close schools, bars, and restaurants; ban large events; close nonessential businesses, shelter-in-place order for everyone but essential workers) instead of maintaining the restrictions for an additional 30 days to June 13, 2020 (and then removing them), the following estimated outcomes would result:

    • 75,000 Californian would die by September 1 compared to 45,000 by maintaining the restrictions through June 13

    • 530,000 Californians would have confirmed cases of COVID-19 by September 1 compared to 490,000 by maintaining the restrictions through June 13..

    • CA would have -$43.5 billion in gross state income (March 1-Junr 13) and -5.5% in annual gross state income during that period compared to -$52.2 billion in gross state income and -6.6% in annual gross state income.

    Sponsor

    Sponsor

    We then tweaked the restrictions to maintain them through July 1, removing all restrictions on July 1 except for closed schools (that would continue to July 30.) That produced the following estimated outcomes: :

    • 40,000 Californians would die by September 1 compared to 14,000 by maintaining the restrictions to July 1

    • 470,000 Californians would have confirmed cases of COVID-19 by September 1 (compared to 320,000 by maintaining current restrictions to July 1.).

    • CA would have -$70.9 billion in gross state income and -8.9% in annual gross state income (March 1 through July 30) compared to -$79.7 billion in gross state income and -10.0% in annual gross state income (March 1 through July 30.)

    Sponsor

    Sponsor

    In an accompanying COVID19 weekly recap, RAND economist Aaron Strong likens the situation to a classic prisoner's dilemma, not a simple trade-off between health and the economy. "I would rather go to the beach [than stay home], but I know that that is not a good alternative for the community," he says. "So, we can either open up completely and have significant consequences, or we can cooperate and create an outcome that may be costly in the short run, but we will have a healthier population and healthier economy in the long run."

    So...based on the RAND modeling anobr, what do you want California's Governor to maintain or change? What do you want LB's elected Mayor and your Council rep to support or oppose? Will their actions on this influence the way you'll vote in LB's 2020 (Council runoffs in districts 2, 6 and 8) snd 2022 election cycles (all citywide electeds plus districts 1, 3, 5, 7 and 9) and if so in what ways?

    Sponsor


    Support really independent news in Long Beach. No one in LBREPORT.com's ownership, reporting or editorial decision-making has ties to development interests, advocacy groups or other special interests; or is seeking or receiving benefits of City development-related decisions; or holds a City Hall appointive position; or has contributed sums to political campaigns for Long Beach incumbents or challengers. LBREPORT.com isn't part of an out of town corporate cluster and no one its ownership, editorial or publishing decisionmaking has been part of the governing board of any City government body or other entity on whose policies we report. LBREPORT.com is reader and advertiser supported. You can help keep really independent news in LB similar to the way people support NPR and PBS stations. We're not non-profit so it's not tax deductible but $49.95 (less than an annual dollar a week) helps keep us online.


    blog comments powered by Disqus

    Recommend LBREPORT.com to your Facebook friends:


    Follow LBReport.com with:

    Twitter

    Facebook

    RSS

    Return To Front Page

    Contact us: mail@LBReport.com


    Adoptable pet of the week:


    Copyright © 2020 LBReport.com, LLC. All rights reserved. Terms of Use/Legal policy, click here. Privacy Policy, click here