LBReport.com

News / Detailed Coverage

See How High Waves Could Be (Or Not Be), Where And How Often Along LB's Shoreline With Possible Breakwater Modifications


LBREPORT.com is reader and advertiser supported. Support independent news in LB similar to the way people support NPR and PBS stations. We're not non-profit so it's not tax deductible but $49.95 (less than an annual dollar a week) helps keep us online.
(Sept. 27, 2018, 3:20 a.m.) -- LBREPORT.com provides below Corps of Engineers graphics showing the agency's draft predicted wave heights and number of days per year such wave heights likely would or wouldn't occur along LB's shoreline under two potential Breakwater modifications.

In a "Draft Wave Modeling Summary" (dated Aug. 28, 2018), the Corps of Engineers states:

The purpose of this brief is to provide a summary of the surface wave modeling results. Only two breakwater modifications will be presented and does not include additional defensive measures that must be incorporated to provide a similar level of protection as the current breakwater configuration. This work is preliminary and may contain errors and omissions. The full coastal engineering analysis will be included in the integrated feasibility report (IFR) to be released at a later time. Only results will be presented and no analysis will be made based on the modeling results in this overview.

Two modifications will be part of a forthcoming COE EIS/EIR (inviting public participation): one would remove the eastern 1/3 (roughly 4,450 feet) of the LB Breakwater; the other would produce two 1,000 ft. notches on the western half of the Brekwater.

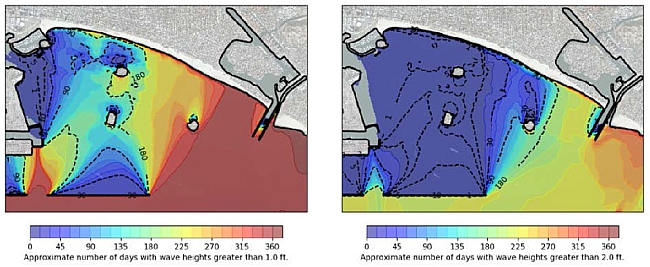
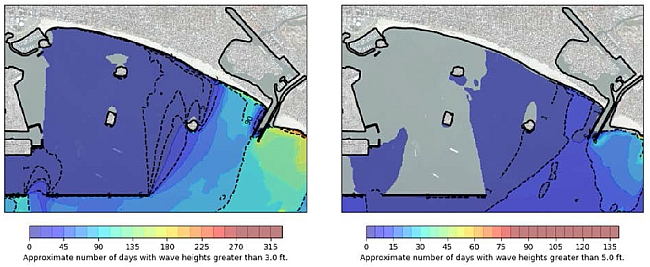
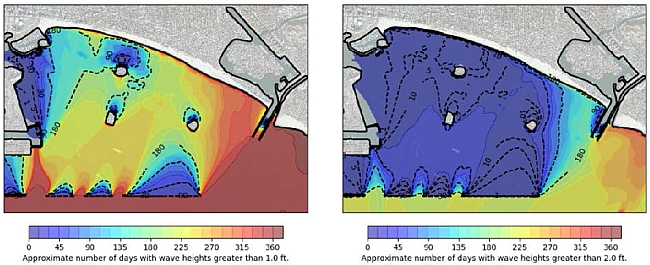
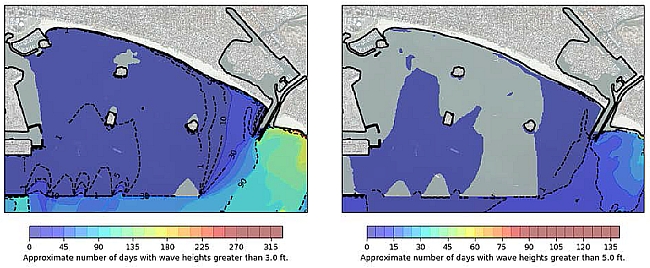
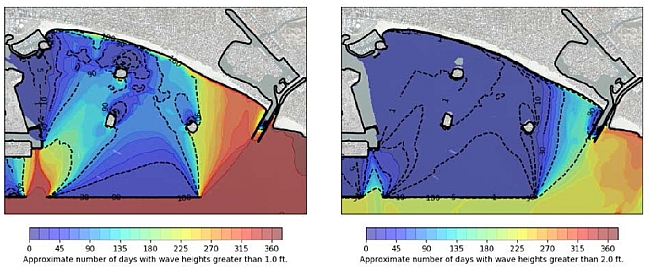
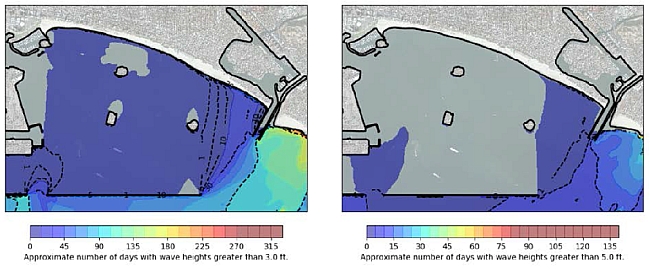
The report notes: "Although reported in days/year for ease of communication, this value is actually a probability and events do not need to occur sequentially (i.e. 1 day of exceedance may consist of four separate events that last 6 hours each, 24 events that last for 1 hour, etc.)."

[Scroll down for further.]


Removal of eastern 1/3 of the Breakwater

The four graphics, left to right, row to row, show the approximate number of days with wave heights greater than 1 ft, 2 ft, 3ft and 5 ft.


Creating two 1,000 ft. notches in western end of the Breakwater

The four graphics, left to right, row to row, show the approximate number of days with wave heights greater than 1 ft, 2 ft, 3ft and 5 ft.


Comparison to current (no project) conditions

The four graphics, left to right, row to row, show the approximate number of days with wave heights greater than 1 ft, 2 ft, 3ft and 5 ft.


Sponsor

Sponsor

Sponsor


Sponsor

Sponsor


Support really independent news in Long Beach. No one in LBREPORT.com's ownership, reporting or editorial decision-making has ties to incumbent Long Beach officials, development interests, advocacy groups or other special interests; or is seeking or receiving benefits of City development-related decisions; or holds a City Hall appointive position; or has contributed sums to political campaigns for Long Beach incumbents or challengers. LBREPORT.com isn't part of an out of town corporate cluster and no one its ownership, editorial or publishing decision making has been part of the governing board of any City government body or other entity on whose policies we report. LBREPORT.com is reader and advertiser supported. You can help keep really independent news in LB similar to the way people support NPR and PBS stations. We're not non-profit so it's not tax deductible but $49.95 (less than an annual dollar a week) helps keep us online.


blog comments powered by Disqus

Recommend LBREPORT.com to your Facebook friends:


Follow LBReport.com with:

Twitter

Facebook

RSS

Return To Front Page

Contact us: mail@LBReport.com


Adoptable pet of the week:


Carter Wood Floors
Hardwood Floor Specialists
Call (562) 422-2800 or (714) 836-7050


Copyright © 2018 LBReport.com, LLC. All rights reserved. Terms of Use/Legal policy, click here. Privacy Policy, click here