(Sept. 2, 2019, 4:20 p.m.) -- In August, most LB Council districts had no shootings...but for mainly working class residents in parts of LB's 1st Council district, the experience was different: sirens, police tape, blocked streets, helicopters overhead...and for the WLB portion of the district, two fatal shootings, producing a per capita homicide rate in August larger than Chicago.
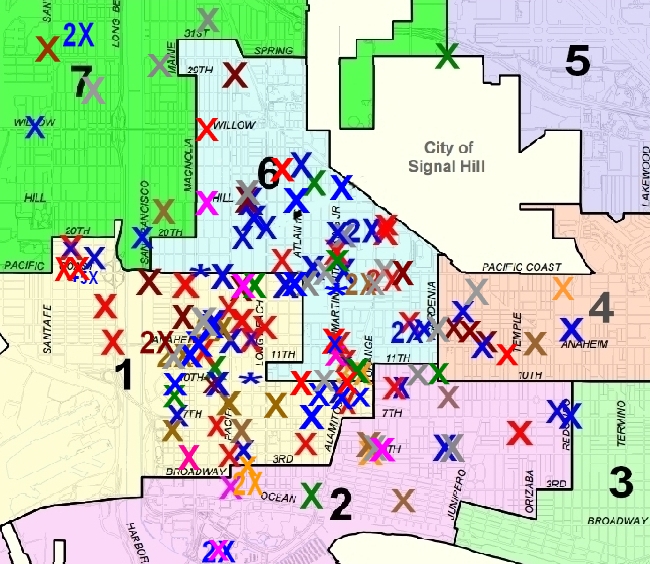
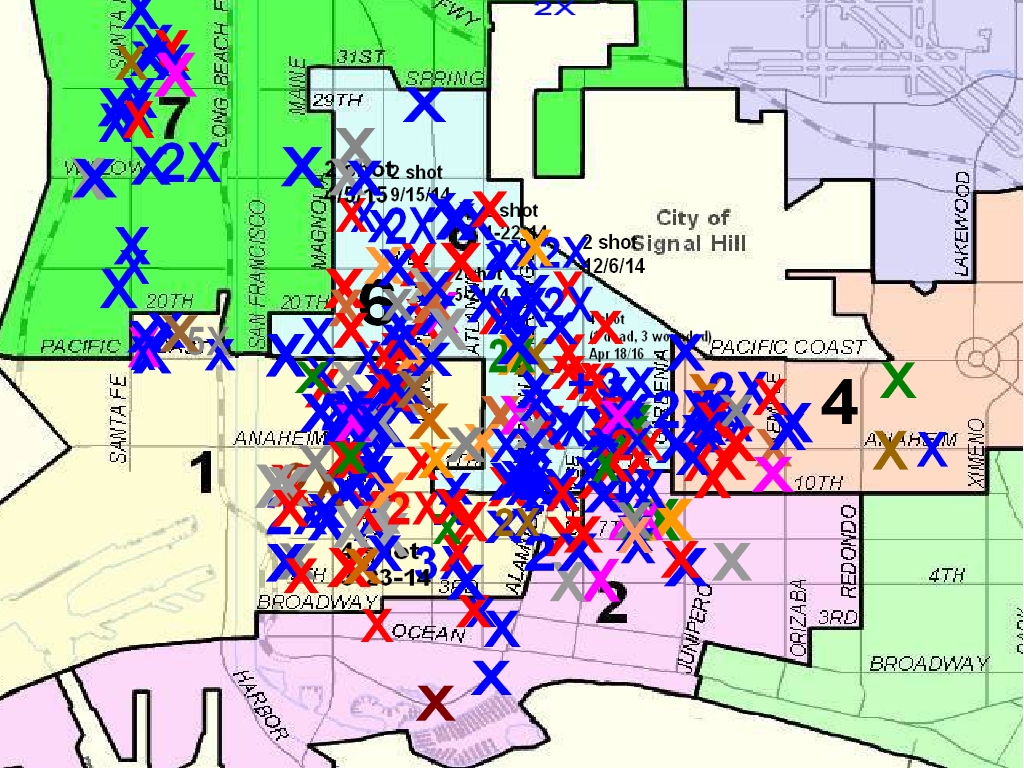
LBREPORT.com notes that the 1st district's August WLB homicides (Aug. 10: Toko Tasi (1500 W. PCH); Aug. 22, Johnny Akins, age 19, also 1500 block W. PCH) are unrelated and to some extent geographically anomalous; most of LB's shootings have impacted Central LB portions of the 1st and 6th districts. In August 2019, the Central LB portion of the 1st district had five additional shooting crime scenes (six if one counts a crime scene on the 10th St. borderline of the 1st dist/6th districts.) Two of the Central LB-area shootings left victims wounded (Aug. 11: 500 block W. Anaheim St. and Aug. 18, 9th St/Olive Ave.) Three other shooting crime scenes had no-persons-hit but with casings found (14th/Chestnut; Anaheim/DeForest; 400 block E. 8th St. at about Elm Ave.) Casings were also found at a 10th St./Myrtle Ave. crime scene (border of 1st/6th districts.) Here's the August homicide math (applies rounded figures, sufficient to demonstrate relative proportions.) Chicago's population is roughly 2.7 million. LB's 1st district population is roughly 50,000 residents. Chicago's population is roughly 54 times the size of LB's 1st Council district (50,000 x 54 = 2.7 million.) In August 2019, Chicago had 46 people fatally shot (a decrease of 18% from 2018.) Source: www.HeyJackass,com (which declares it is "illustrating Chicago values.") That's a rate of roughly 1.7 fatal shootings per 100,000 Chicago residents (46/27 = rate of 1.7 per 100,000). During the same August 2019 period, LB's 1st Council districts had 2 people fatally shot. That's a rate of 4.0 fatal shootings per 100,000 1st dist. residents (2/0.5 = rate of 4.0 per 100,000.) [Scroll down for further.] |
Below are maps showing cumulated shootings in the Central-WLB portions of LB from Jan. 2018 to the present (top map) for context from Jan. 1, 2014 to Dec. 31, 2017 (second map).
Map below from Jan. 1, 2014 through Dec. 31, 2017.
For citywide perspective, LBREPORT.com also provides a continually updated link on our front page to a chart showing shootings (fatal and non-fatal) by Council districts. To view it, click here. From mid-July 2014 to mid-June 2019, the 1st Council district was represented by Councilwoman/now state Senator Lena Gonzalez. A "winner-take-all" no runoff special election is scheduled on November 5 to fill the now-vacant 1st dist. Council seat.
Although police will say (accurately) that "no persons were injured" in some shootings, every shooting injures an entire neighborhood and its families. In addition to the disruptive sirens, helicopters, blocked streets and police presence, a shooting injures an entire neighborhood, its families and children, their sense of security and well-being. LBREPORT.com has repeatedly cited the "tale of two cities" disproportionate level of shootings impacting working class and historically disadvantaged parts of LB as the the City's most serious chronic inequity. Some LB officials (including Mayor Garcia in recent appearances) cite "citywide" LB homicide and other crime stats. This hides the inequity because the "citywide" numbers include parts of LB with low violent crime numbers. Some may also note that Chicago's fatal shootings are concentrated in two areas (the city's southside and westside) although we used the city's citywide population figure. That's true, but it doesn't undermine the fundamental inequity demonstrated by the numbers. .
blog comments powered by Disqus Recommend LBREPORT.com to your Facebook friends:
Follow LBReport.com with:
Contact us: mail@LBReport.com |
Hardwood Floor Specialists Call (562) 422-2800 or (714) 836-7050 |