 |
|
By the Numbers: 2012 Property Crimes (Burglaries & Thefts/Larceny) Compared by Council Districts Mapping and Analysis by Jennifer Gomez
|

 |
|
|
By the Numbers: 2012 Property Crimes (Burglaries & Thefts/Larceny) Compared by Council Districts Mapping and Analysis by Jennifer Gomez
|
|
(Feb. 14, 2013) -- LBREPORT.com reports below Long Beach City Council districts ranked by their Part 1 crimes against property broken into two categories:
Regarding reported burglary crimes, the data show:
These data were tabulated using LBPD's officially reported crime data but the tables below were not produced by the City of Long Beach or by LBPD. The crime totals were aggregated from LBPD Reporting Districts to represent Council District boundaries as closely as possible. Council boundaries and LBPD reporting districts aren't perfectly congruent but for statistical purposes, they are very close. Burglaries (res + comm'l + auto burglaries)
These data are displayed on the graph below. 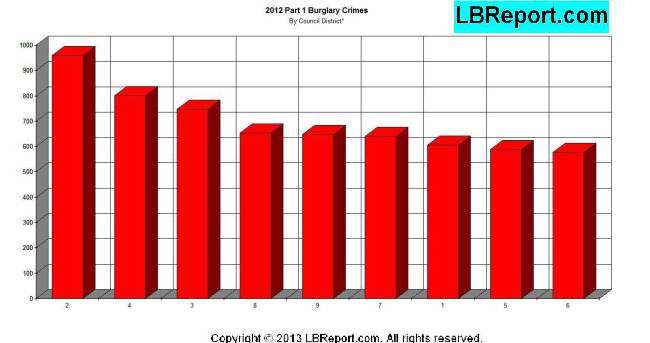
Regarding reported theft/larceny crimes:
Theft/Larceny crimes (grand theft + auto theft + bike theft + petty theft)
These data are displayed on the graph below. 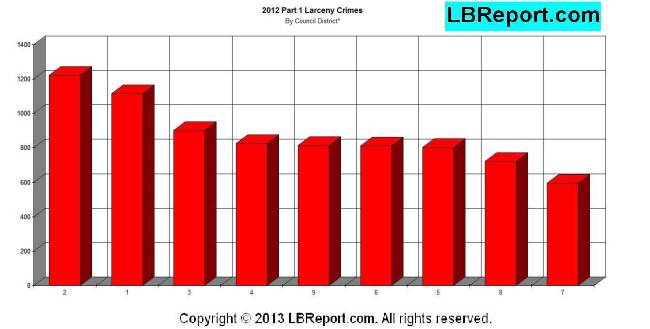 We accompany these data with context and caveats. Some official statistical categories combine more than one type of crime. An "Aggravated Assault" may be a shooting, or an assault with a knife, or a person hitting their spouse. LBREPORT.com will provide greater detail on these distinctions as we get them. We include auto burglaries with residential and commercial burglaries. In similar fashion, auto thefts are put on the same map as other theft/larceny crimes (grand theft, bike theft and petty theft). LBPD organizes these crimes differently for its statistical purposes. Council district lines are political and thus to some extent inherently arbitrary, but since elected officials routinely seek credit for what takes place in their districts, we think it's appropriate to report crime by the Council districts that Councilmembers were elected to represent. Not all areas within a Council district experience the average rate. Some portions of a Council district may have average rates that are higher and lower than the average. As with any jurisdiction, crime stats only show crimes that are reported and some property crimes may go unreported for various reasons (the victim may have no confidence their property will be recovered; or may fear retribution from perpetrators or gangs, or for whatever reason may not want to interact with the police). Although statisticians distinguish between "crimes against persons" and "crimes against property," in our view these are both fundamentally crimes against persons. The person is the victim, not the property. Every statistic represents a person who became a crime victim in the City of Long Beach. They are not just numbers. They are people. Beyond those directly victimized, others living and working in crime-impacted areas have likely experienced streets blocked off by police vehicles, helicopters whirring overhead or may have been prevented from entering or leaving their neighborhoods by crime scene tape. Neighbors who've seen neighbors victimized may now take steps, some costly, others burdensome, to avoid becoming a victim as well. Their quality of life is impacted by what takes place around them even though they're not counted in the statistics below. LBREPORT.com welcomes your response to this data. Let us know in what part of town you are (major cross-streets are fine), who your Councilmember is and what voted actions you want him or her to take in response to this data. Use our Facebook and Disqus comment systems below to share your views...and feel free to let your friends and neighbors know about this page (via Facebook, Twitter or email). And watch for additional crime data coming...on LBREPORT.com.
Contact us: mail@LBReport.com |
          Hardwood Floor Specialists Call (562) 422-2800 or (714) 836-7050  |
Contact us: mail@LBReport.com