|
Current conditions: Forecasts (highs/lows may differ considerably depending on distance from shore.): Doppler radar/satellite images from the National Weather Service (NWS) plus explanatory details and further weather links below. In-Motion Santa Ana Mtn. in-motion Doppler Radar:
In-Motion Ventura County (Sulphur Mtn) in-motion Doppler Radar
Still-images / updated Doppler Radar. Explanatory details are below the map. Click refresh or reload on your browser for most recent image. Santa Ana Mtn. NOAA Doppler radar
If both sites are unavailable, try Alternate NOAA regional radar sites. The Doppler Radar also lets you judge relative rainfall amounts [NWS text & graphics]:
What do the colors mean in the reflectivity images? The colors are the different values of energy that are reflected back toward the radar. Called echoes, the reflected intensities are measured in dBZ (decibels of z). As the strength of the signal returned to the radar increases the dBZ values increases. The Doppler radar does not determine where rain is located, only areas of returned energy. The "dB" in the dBz scale is logarithmic and has no numerical value, but is used only to express a ratio. The "z" is the ratio of the density of water drops (measured in millimeters, raised to the 6th power) in each cubic meter (mm^6/m^3). Mathematically: dBz= 10 * log (z/z0) Where z = reflectivity factor and Z0 is defined to be 1 mm^6/m^3
When the "z" is large (many drops in a cubic meter), the reflected power is large. A small "z" means little returned energy. In fact, "z" can be less than 1 mm^6/m^3 and since it is logarithmic, dBz values will become negative, as often in the case when the radar is in clear air mode and indicated by earthtone colors. The scale of dBZ values is also related to the intensity of rainfall. Typically, light rain is occurring when the dBZ value reaches 20. The higher the dBZ, the stronger the rainrate. Learn more about these reflectivity color scales.The National Weather Service has also produced the Doppler Radar overlaid with mountains, rivers, county lines, weather warnings, an explanatory legend and links to other NWS/NOAA related products, To access it, click here. [end MWS text] "UTC" (displayed on the image) is "Universal time" (formerly called "Greenwich Mean Time"). It's eight hours ahead of Pacific Standard Time (in the winter, fall back) and seven hours ahead of Pacific Daylight Time (in the summer, spring ahead). That means "15:15 UTC" is 7:15 a.m. Pacific Standard Time (during the winter) and 8:15 a.m. Pacific Daylight Time (during the summer). To see the infrared imagery in motion, Animation of infrared radar satellite image [2 km]
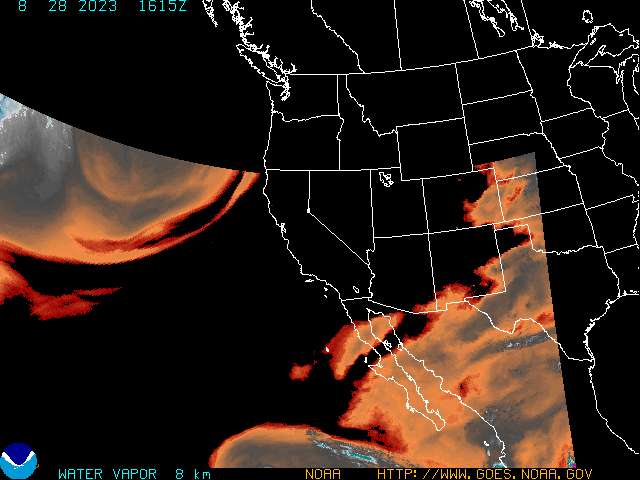
Water Vapor (color enhanced imagery): To see Water Vapor animated, click here. (Nat'l Weather Service Text) Color enhanced imagery is a method meteorologists use to aid them with satellite interpretation. The colors enable a meteorologist to easily and quickly see features which are of special interest to them. Usually they look for high clouds or areas with a large amount of water vapor...In a water vapor image, white areas indicate moisture and dark areas indicate little or no moisture, so the colors typically highlight areas with large amounts of moisture. LBReport.com is also pleased to provide these additional weather-related links:
Note on National Weather Service/NOAA imagery: Click refresh or reload on your browser for most recent image. The National Weather Service advises: The information on government servers are in the public domain, unless specifically annotated otherwise, and may be used freely by the public. Before using information obtained from this server special attention should be given to the date & time of the data and products being displayed. This information shall not be modified in content and then presented as official government material.
blog comments powered by Disqus
Contact us: mail@LBReport.com Get free e-mail news alerts: subscribe@LBReport.com Copyright © 2000-2013 LBReport.com, LLC. All rights reserved.
|